NZD USD Forex Pair Faces Strong Resistance Zone
The NZD/USD, commonly known as the Kiwi due to New Zealand’s national bird, is a widely traded forex pair, highly sensitive to commodity prices and economic data from New Zealand and the United States. Today’s fundamental outlook for NZD/USD will be impacted by the delayed US durable goods orders data, residential building permits, and industrial production figures, all key indicators for gauging economic health and future manufacturing activities. Additionally, market participants will closely watch speeches by Federal Reserve Governor Michelle Bowman and RBNZ Governor Anna Breman, looking for cues on interest rate adjustments. Given the expected volatility from these events, traders should anticipate possible fluctuations, especially if the data significantly deviates from forecasts, influencing the USD strength or weakness and impacting the Kiwi accordingly.
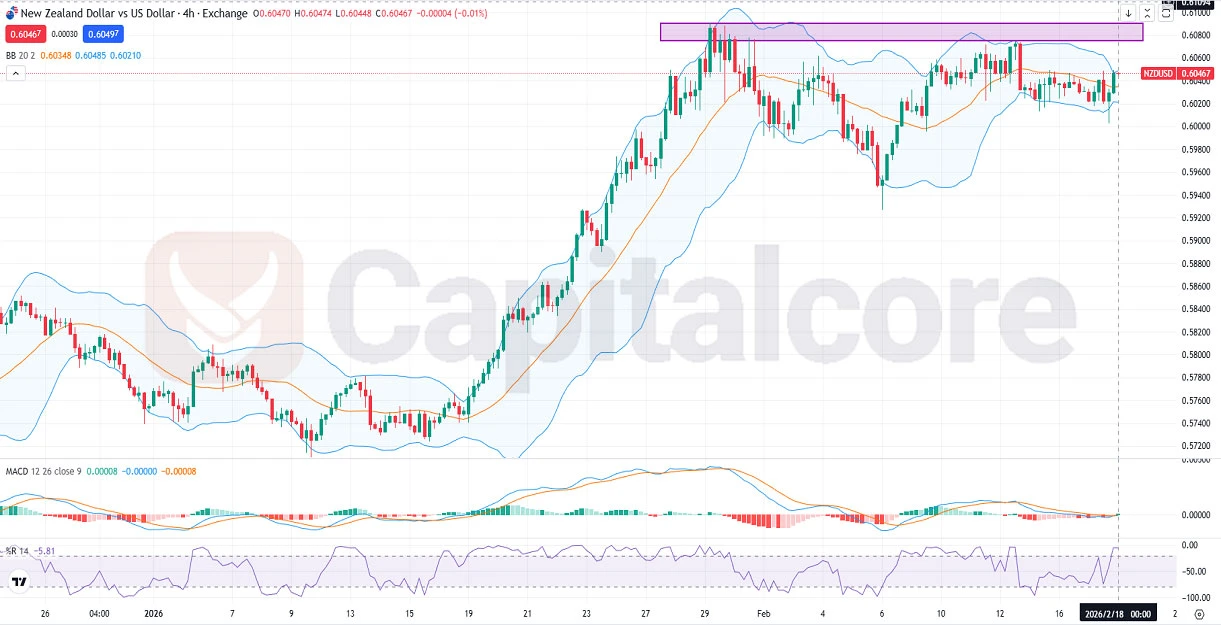
Chart Notes:
• Chart time-zone is UTC (+02:00)
• Candles’ time-frame is 4h
Analyzing the NZD/USD H4 technical chart, the long-term trend has been predominantly bearish, but a recent sharp bullish correction has taken the price action into a robust resistance zone around 0.6080-0.6100. The candles have struggled to breach this area, resulting in sideways consolidation. This indecision in price action, combined with narrow Bollinger Bands (20-period) suggests an impending volatility expansion. The MACD indicator (12,26,9) currently shows a neutral bias with readings at 0.00008 and -0.00008, indicating low momentum. Additionally, the Williams %R (14) is at -5.81, signaling the pair is close to overbought conditions. Considering the overall bearish market structure and these technical indicators, there is potential for NZD/USD to revert to the downside following this consolidation.
•DISCLAIMER: Please note that the above analysis is not an investment suggestion by “Capitalcore LLC”. This post has been published only for educational purposes.


