GOLD Fundamental Analysis Before Fed Speech
GOLDUSD, also known as XAUUSD, represents spot gold priced against the US dollar, with gold often nicknamed the yellow metal and widely traded as a safe haven forex and commodity pair. For today’s XAUUSD fundamental analysis, traders are focused on Federal Reserve Governor Michael Barr’s FOMC speech, the New York Manufacturing Index, Capacity Utilization, and Industrial Production data; hawkish Fed remarks or stronger than expected US data could support the USD and pressure gold prices, while softer data or dovish policy signals may weaken the dollar and help GOLD-USD buyers defend the bullish price action setup.
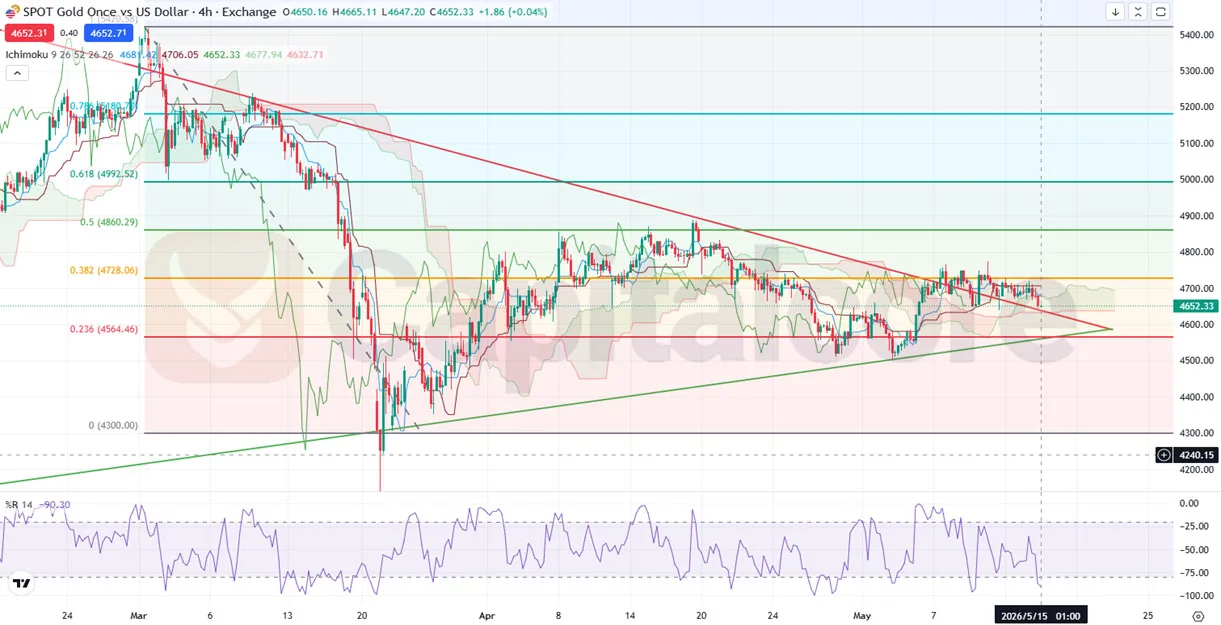
Chart Notes:
• Chart time-zone is UTC (+03:00)
• Candles’ time-frame is 4h
On the XAUUSD H4 chart, gold is showing bullish consolidation after breaking above the long term descending trendline and retesting it as support, which improves the probability of a continuation move if buyers hold control. Price is compressing inside a smaller triangle near the 0.382 Fibonacci retracement around 4728, while the 0.236 Fibonacci level near 4564 remains the key structural support for GOLD price action. The Ichimoku Cloud is shifting from bearish to neutral bullish as candles stabilize near the cloud edge, with Tenkan and Kijun flattening, showing reduced downside momentum. The previous larger triangle breakdown triggered the sharp selloff, but current H4 price action suggests accumulation above reclaimed resistance rather than immediate bearish continuation. Williams %R is recovering from oversold territory, indicating that selling pressure is fading and buyers may be preparing for a bullish breakout attempt toward higher resistance zones if the upper triangle boundary is cleared decisively.
•DISCLAIMER: Please note that the above analysis is not an investment suggestion by “Capitalcore LLC”. This post has been published only for educational purposes.


