Bitcoin Price Action Targets Fibonacci Resistance
BTC/USD, commonly known as Bitcoin against the US Dollar or simply Bitcoin, is the most widely traded cryptocurrency pair in the world and serves as a benchmark for the broader digital asset market. In this BTC/USD daily chart technical and fundamental analysis, traders are closely monitoring key US economic releases, including Producer Price Index (PPI) data, Initial Jobless Claims, Natural Gas Storage figures, and the 30-year Treasury Bond Auction. Stronger-than-expected PPI readings or lower Jobless Claims could reinforce expectations of tighter monetary policy and support the US Dollar, potentially weighing on risk-sensitive assets such as Bitcoin. Conversely, softer inflation and labor market data may improve risk sentiment and support cryptocurrency demand. Therefore, today’s BTC/USD fundamental analysis suggests that macroeconomic developments and interest rate expectations remain the primary drivers of short-term Bitcoin price action.
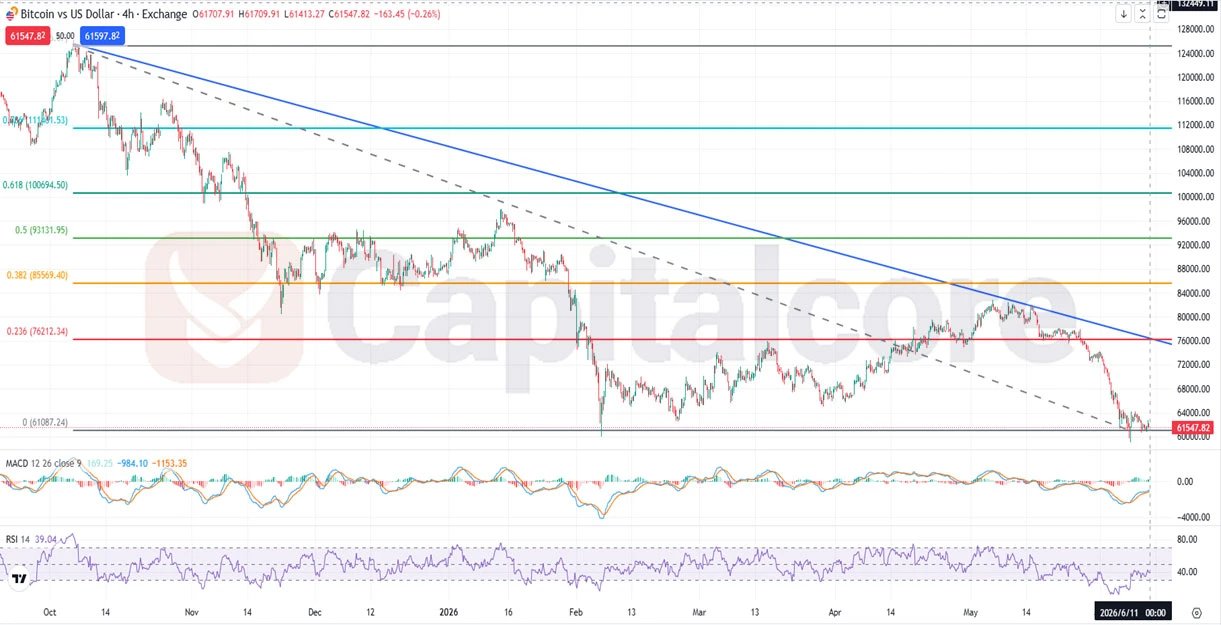
Chart Notes:
• Chart time-zone is UTC (+03:00)
• Candles’ time-frame is 4h
On the BTC/USD H4 chart, despite the long bullish correction phases in the chart signaling a potential recovery of the Bitcoin market, sellers have repeatedly regained control by creating strong selling pressure after each gradual bullish advance. The broader price structure remains bearish, with the descending trendline continuing to cap upside attempts. According to the Fibonacci retracement levels, the recent decline has pushed the candles back toward the major support zone around 61,000, but if buyers begin to absorb the current selling pressure, the chart could recover at least toward the 0.236 Fibonacci retracement level at 76,212, which remains the first major upside target. The MACD (12,26,9) readings of 169.25, -984.10, and -1153.35 indicate that bearish momentum remains dominant, although the shrinking downside pressure hints at a possible stabilization phase. Meanwhile, the RSI (14) at 39.04 remains below the neutral 50 level, reflecting weak bullish momentum while staying above oversold territory. Overall, the current BTC/USD technical analysis points to a market attempting to establish a base near support, with recovery potential dependent on improving sentiment and a break in the prevailing bearish price action structure.
•DISCLAIMER: Please note that the above analysis is not an investment suggestion by “Capitalcore LLC”. This post has been published only for educational purposes.