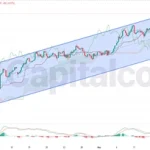
Although the main trend in daily chart is bearish, the upward momentum is created. So, a shifted momentum to the upside is observable; this creates the possibility of a trend reversal. Breaking of the ascending trendline and a retest of the area will be a great signal for a bullish wave.
Chart Notes:
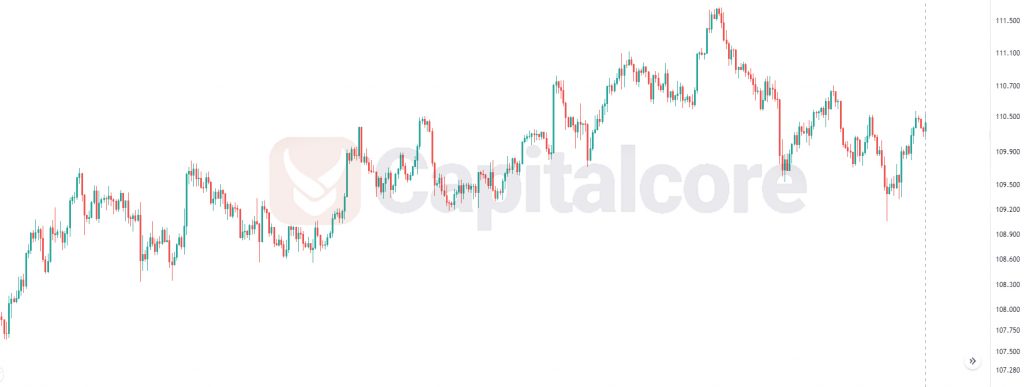
• Chart time-zone is UTC (+03:00)
• Candles’ time-frame is 4h.
The support rests at 110.09 with resistance at 110.20 and the price is moving above the Pivot Point at 110.15. The EMA of 10 is moving in bullish bias in ascendant channel reaching to EMA100 and EMA of 200. The RSI is moving above the level of 50, the MACD histogram is in positive territory and is going to generated a crossover sell signal. The Stochastic is moving toward the oversold area and the ADX is not showing a clear signal. The price is above the Ichimoku Cloud and the Chinkou Span is far away the market price. The Tenkan-sen is showing an upward momentum but the Kijun-sen is showing a downward momentum toward a horizontal state.
• There is resistance at 110.20, followed by resistance at 110.26 and 110.31.
• There is support at 110.09 Below, there is 110.04 and 109.98.
• DISCLAIMER: Please note that the above analysis is not an investment suggestion by “Capitalcore Ltd”. This post has been published only for educational purposes.