Look for an ascending signal
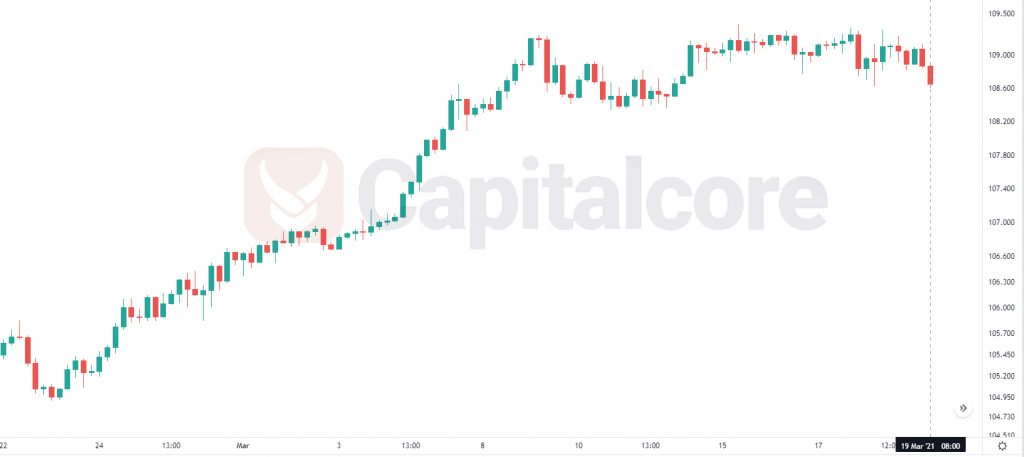
National CPI, Monetary Policy Meeting Minutes and BoJ MPC Interest Rate data was released in Japan and the US will publish Baker Hughes U.S. Rig Count. On the chart, the price has had a big growth and now is on a support level. If the support can hold the price the next move of the chart would be bullish.

Chart Notes:
• Chart time-zone is UTC (+03:00)
• Candles’ time-frame is 4h.
The support rests at 108.490 with resistance at 109.330 which the weekly pivot point at 108.860 is located in between the lines. The EMA of 10 is moving with bearish bias in the long term ascendant channel and it is above the EMA of 100 and the EMA of 200. The Stochastic is showing downward momentum, the RSI is moving below level 50. The MACD is moving in negative territory and the ADX is showing sell signal.
As long as the support line remains intact, USDJPY can grow towards 110; on the other hand, at any point if the support cant not hold the price, sellers can be expecting to see the price at 107.5 .
• DISCLAIMER: Please note that the above analysis is not an investment suggestion by “Capitalcore Ltd”. This post has been published only for educational purposes.


