Ascending signals have been issued
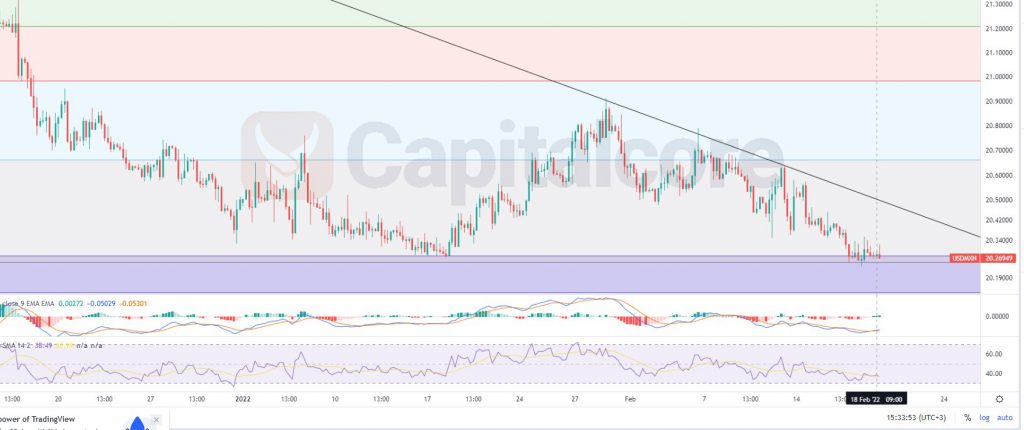
USD/MXN has been moving within a descending trend line since 26th November 2021; the trend line has prevented the price from ascending 4 times and therefore it is potential of making another trend reversal. Different indicator are issuing buy signal; bullish signals out number bearish ones by much, short-term long positions are more potential to hit the target point.

Chart Notes:
• Chart time-zone is UTC (+03:00)
• Candles’ time-frame is 4h.
On USD/MXN price chart, the price at the moment is on 20.2695 which would be just inside the support zone, shown as a purple zone on the price chart. The support zone is considered to be placed on 20.13458 – 20.2764 . The black line on the chart demonstrates the dynamic support zone which started forming on 26th on November 2021. RSI is showing positive divergence, comparing the closest Vallie and the current position of the price. For scalpers, long poisonings heading to the dynamic support zone would be more probable to hit the target point. Long term traders can be waiting for the price line to break above the dynamic support and on the pullback, they can enter long positions; different Fibonacci levels would be good prices to be looked upon as target points. Please consider that in case the purple zone gets broken, the theory would be out dated.
• DISCLAIMER: Please note that the above analysis is not an investment suggestion by “Capitalcore Ltd”. This post has been published only for educational purposes.


