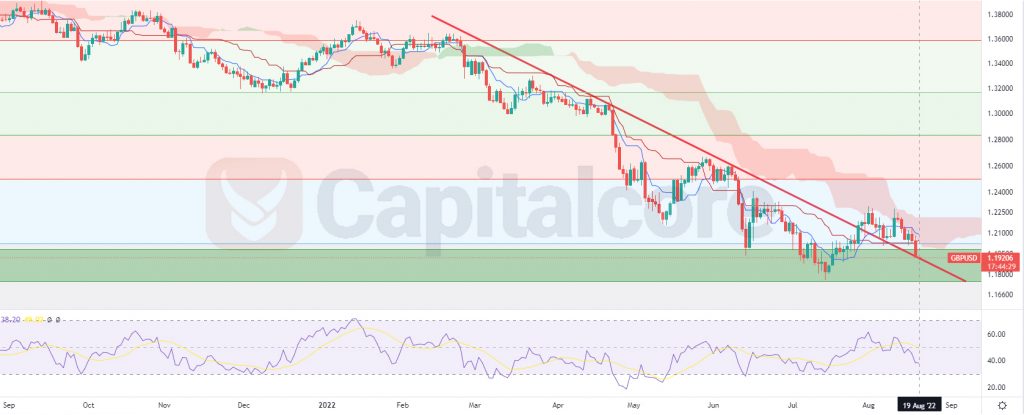

GBP/USD started a descending trend on 23rd of February 2022, which caused the price on this chart to descend to almost 13.7% until 14th of July 2022. The price line is now on a strong support zone, different indicators have issued positive signals, and a trend reversal looks potential on the chart.
Chart Notes:
• Chart time-zone is UTC (+03:00)
• Candles’ time-frame is daily.
The price line on this pair is currently indicating 1.19206, which would be located just inside a strong resistance level on weekly timeframe, which is indicated as a green zone below the price line. This area has already been able to pump the price several times and therefore is considered as an important level. The price line has already penetrated Ichimiku cloud and the Conversion line has broken above the Base line. RSI is on a bullish trend, and has issued multiple bullish divergence signals. The descending red line on the chart indicates the trend line, which formed the current bearish wave; as it is reflected on the chart, this trend line is broken and a complex pullback has been made to it. Trades can enter long positions, heading to 1.26385 and 1.32705. Please note that, the validity of the analysis would expire in case the price line breaks below 1.17180.
• DISCLAIMER: Please note that the above analysis is not an investment suggestion by “Capitalcore Ltd”. This post has been published only for educational purposes.