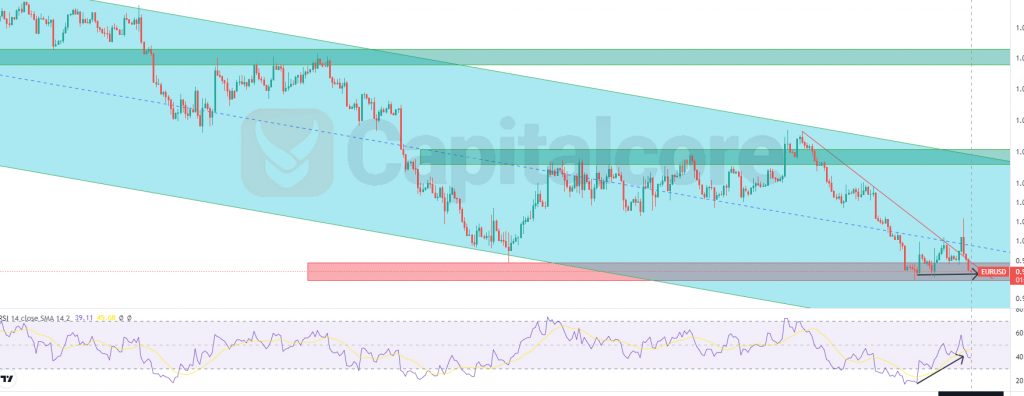

The price line on EUR/USD price chart has been moving within a bearish channel since mid-December 2021 and after a significant fall, the price line is now on a strong resistance level. Some indicators are issuing bullish signals and the bearish power on this pair seems to be reducing.
Chart Notes:
• Chart time-zone is UTC (+03:00)
• Candles’ time-frame is 1h.
The price line on EUR/USD price chart is currently indicating 0.99274; this area is located just inside a strong support zone, which has already been able to pump the price line several times. The red square on the chart indicates the mentioned support zone and the green squares are indicating two important resistance zones above the price line. The descending blue zone reflects the bearish channel, which has been formed and remained valid for a long while. RSI is issuing positive divergence, which is highlighted using two black arrows on the price chart and RSI. Traders can be waiting for the price line to break above the dynamic resistance, which is illustrated as a descending red line, and then they can enter long position on the retest of the support zone. The target for the upcoming ascending wave could be considered on the resistance levels, which were mentioned above.
• DISCLAIMER: Please note that the above analysis is not an investment suggestion by “Capitalcore Ltd”. This post has been published only for educational purposes.