UK-100 Bollinger Bands Confirm Market Compression
UK100, also known as the FTSE 100 or “Footsie,” represents the top 100 companies listed on the London Stock Exchange and is strongly influenced by UK economic sentiment, GBP movements, global risk appetite, and Bank of England policy expectations. For today’s UK100 H4 technical and fundamental analysis, traders will closely watch BOE Governor Andrew Bailey’s speech at the Reykjavik Economic Conference, as any hawkish comments on inflation or interest rates could support the British pound and potentially pressure UK100 price action, while a softer tone may improve market sentiment and support the index.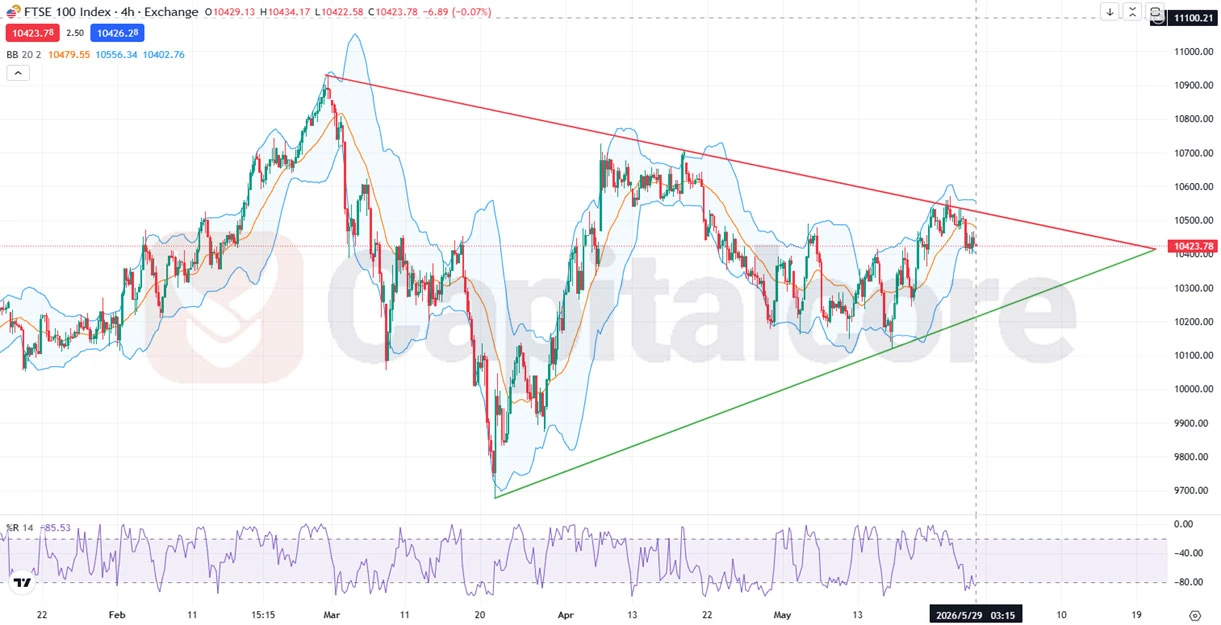 Chart Notes:
• Chart time-zone is UTC (+03:00)
• Candles’ time-frame is 4h
The UK100 H4 chart shows price compressing inside a symmetrical triangle, with lower highs from descending resistance and higher lows from ascending support, indicating a volatility squeeze and a possible breakout setup. Bollinger Bands have narrowed, confirming consolidation, while price rejection near the upper band and movement back toward the mid-band suggest weakening bullish momentum. Williams %R has fallen from overbought territory toward the lower zone, showing fading buying pressure, though not yet a fully oversold condition. Rejection wicks near resistance and smaller candles reflect market indecision as price approaches the triangle apex. Overall, UK-100 H4 price action suggests that a breakout may be near, but short-term momentum slightly favors sellers unless buyers reclaim the upper trendline with strong confirmation.
•DISCLAIMER: Please note that the above analysis is not an investment suggestion by “Capitalcore LLC”. This post has been published only for educational purposes.


