
The price line on USD/CAD price chart has been going through an ascending wave since 11th of November 2022. The bullish slope of the price line has recently started educing, showing weakness among the bulls. Different indicators have issued bearish signals and the possibility for a bearish wave has highly increased.
Chart Notes:
• Chart time-zone is UTC (+03:00)
• Candles’ time-frame is weekly.
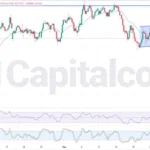
The price line on USD/CAD froze on 1.35948, when the market closed at the end of the week. There a strong resistance level just above the price line, indicated as a light red zone. The price line is now reacting to this area and the support zone stays with a considerable distance to the price line. This dynamic support level is reflected as a red ascending wave on the chart. RSI has formed a lower climax, comparing to the previous climax on the chart, showing the potential of a bearish wave to occur. Traders could expect a bearish trigger on the chart, after which they can enter short positions heading to the demand zones at 1.34 and 1.323. Also, please note that in case the price line breaks above 1.375, the possibility of a bearish wave would highly reduce.
• DISCLAIMER: Please note that the above analysis is not an investment suggestion by “Capitalcore Ltd”. This post has been published only for educational purposes.