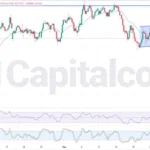

The price line on USD/ZAR price chart started an up trend on 12th of January 2023. The trend was formed within a bullish channel. On February the 6th, the price line finally broke above this channel but as it seems this up trend is not going to last long.
Chart Notes:
• Chart time-zone is UTC (+03:00)
• Candles’ time-frame is 4h.
The price line is currently showing 17.61054 where is located just above the bullish channel. MACD is showing a powerful bullish trend but is now reaching out to a resistance level. The bullish channel is indicated with light red color and as it can be seen on the chart the price line has just broken above this channel. RSI is approaching the over buying area and a bearish wave seems to be close. The candle pattern is also confirming the bearish potential. Traders can keep a sharp eye on shorter time frames to indicate any bearish trigger being ignited; there they can enter short positions heading to the mid and bottom line of the channel. The target of the downtrend could be considered on 17.35610 and 17.07777.
• DISCLAIMER: Please note that the above analysis is not an investment suggestion by “Capitalcore Ltd”. This post has been published only for educational purposes.