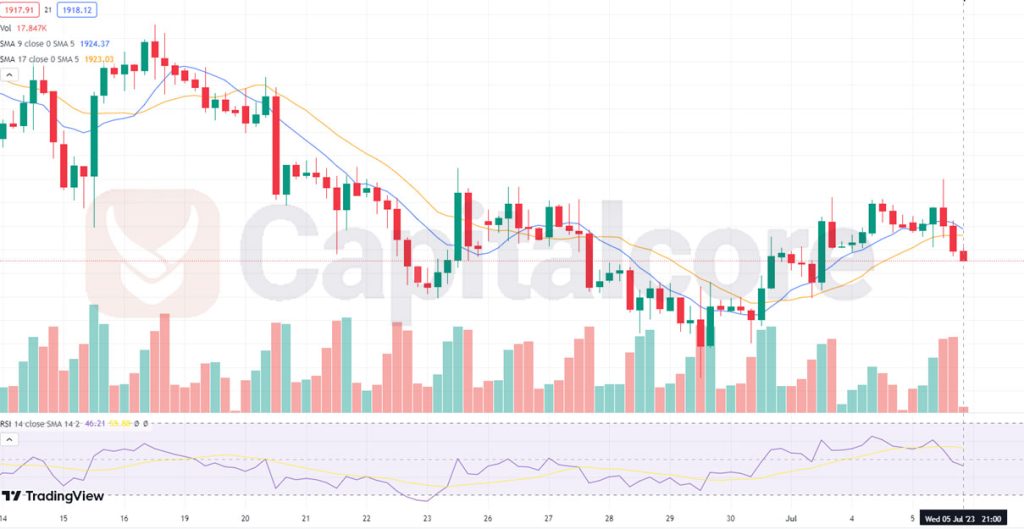
Gold Prepares for Potential Breakout
Gold shows a consolidation pattern as the 17-day and 6-day SMAs move closely. RSI near centerline indicates balanced buying and selling pressure. Traders await breakout or reversal signals for clearer market direction.

Chart Notes:
• Chart time-zone is UTC (+03:00)
• Candles’ time-frame is 4h.
Gold has been exhibiting a notable price pattern as indicated by the 17-day and 6-day Simple Moving Averages (SMAs), which have been moving closely together. This convergence of the SMAs suggests a period of consolidation or indecision in the market. Traders should closely monitor this pattern, as it often precedes a significant price move, potentially indicating a breakout or a trend reversal. Furthermore, the Relative Strength Index (RSI) is hovering near the centerline, indicating a balanced state between buying and selling pressure. This further supports the notion of a market in consolidation. To gain a more comprehensive understanding of Gold’s future direction, traders should consider additional technical indicators and factors such as key support and resistance levels, trend lines, and any relevant fundamental news that may impact the precious metal market. It’s important to exercise caution and wait for a clear confirmation or a significant breakout from the consolidation pattern before taking any trading positions.
• DISCLAIMER: Please note that the above analysis is not an investment suggestion by “Capitalcore Ltd”. This post has been published only for educational purposes.


