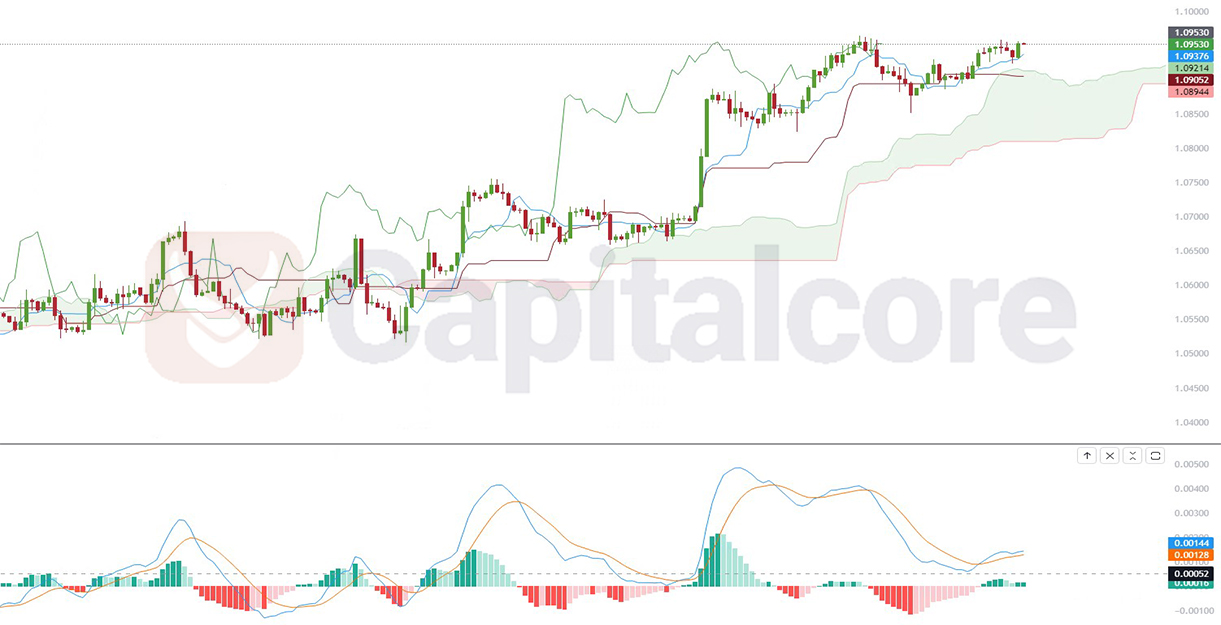
Bullish Trends Unveiled: EUR/USD Ichimoku Cloud Analysis
The recent trends in the EUR/USD pair, as observed through the Ichimoku analysis on the T4 timeframe, indicate a bullish sentiment. The last cloud, being green, aligns with an upward trend, especially since the price candles are positioned above the cloud. This suggests a strong upward momentum. Additionally, the conversion and base lines residing below the candlesticks further affirm the bullish dominance in the market. Traders might consider this a favorable sign for potential long positions, keeping in mind that the market’s volatility could shift the momentum.

Chart Notes:
• Chart time-zone is UTC (+03:00)
• Candles’ time-frame is 4h.
In terms of the Moving Average Convergence Divergence (MACD) analysis, the EUR/USD pair shows promising bullish signals on the T4 timeframe. The last histogram bars are green, indicating a growing bullish momentum. Moreover, both the signal line and the MACD line are positioned above the histogram. This configuration typically suggests that the bullish trend is gaining strength. Traders using MACD as a part of their strategy might view this as a confirmation to maintain or initiate long positions, while also being cautious of any sudden changes in market dynamics that could alter the trend.
• DISCLAIMER: Please note that the above analysis is not an investment suggestion by “Capitalcore Ltd”. This post has been published only for educational purposes.


