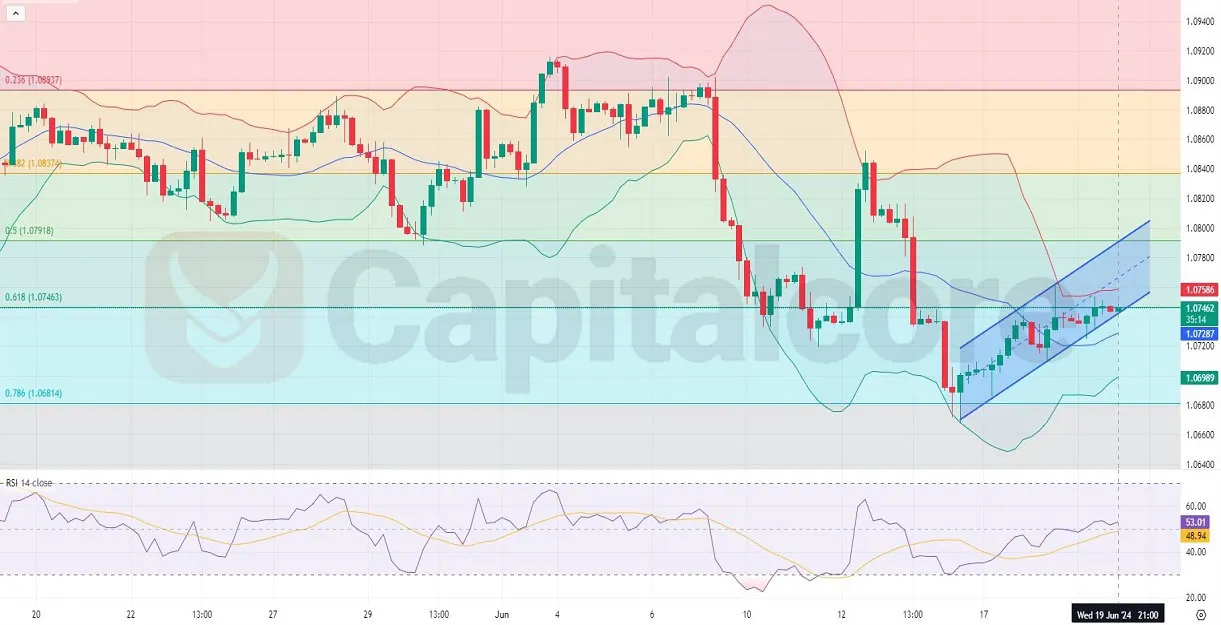
Impact of Upcoming Economic Data on EURUSD H4 Technical Indicators
The EUR/USD, commonly known as “Fiber,” is the most traded currency pair in the forex market, reflecting the exchange rate between the euro (EUR) and the U.S. dollar (USD). This pair is heavily influenced by economic developments in both the Eurozone and the United States, making it a key indicator for global economic health. Today, traders are closely watching several low-impact Eurozone reports, including the German PPI m/m, ECB Economic Bulletin, Spanish 10-y Bond Auction, and Consumer Confidence. Additionally, significant attention is on high-impact U.S. data such as Unemployment Claims, Building Permits, and the Philly Fed Manufacturing Index. If the German PPI exceeds forecasts, it may provide slight bullish support for the euro. Conversely, strong U.S. data, particularly a lower-than-expected unemployment claims figure, could bolster the dollar, adding potential downward pressure on the EUR-USD pair.

Chart Notes:
• Chart time-zone is UTC (+03:00)
• Candles’ time-frame is 4h.
The H4 chart of EUR/USD indicates a bullish momentum with the last 10 candles showing six green and bullish candles. The price has been moving from the middle Bollinger Band towards the upper band, signifying potential upward movement. The Bollinger Bands have tightened compared to the previous week, indicating decreased volatility yet a bullish trend. The RSI is around 53, moving away from oversold territory, supporting a positive outlook. The EURUSD chart price action is currently around the 0.618 Fibonacci retracement level, which acts as a significant support and resistance zone. This alignment of indicators suggests a continuation of the bullish trend, provided there are no major disruptions from the upcoming economic data.
• DISCLAIMER: Please note that the above analysis is not an investment suggestion by “Capitalcore Ltd”. This post has been published only for educational purposes.


