GBPUSD H4 Chart Analyzing Bearish Momentum
The GBP/USD currency pair, often referred to by its nickname “Cable,” is a widely traded forex pair that represents the British Pound against the US Dollar. The GBP USD forex pair is known for its high volatility and sensitivity to both economic data and geopolitical events from the United Kingdom and the United States. Today, the forex market anticipates several impactful news releases for both currencies, including the UK’s Retail Sales, Flash Manufacturing PMI, and Flash Services PMI, as well as the US Flash Manufacturing PMI and Flash Services PMI. From a fundamental perspective, the GBP is poised to react to several high-impact news releases today. The Retail Sales m/m is expected to show a significant increase at 1.6%, indicating robust consumer spending which is positive for the GBP. The Flash Manufacturing PMI and Flash Services PMI are both forecasted to be above the 50.0 mark, suggesting expansion in these sectors and potentially bolstering the GBP. Conversely, for the USD pair, the Flash Manufacturing PMI is expected at 51.0 and Flash Services PMI at 53.4, both indicating expansion but not strong enough to significantly outpace the GBP data. The outcome of these reports could lead to increased volatility in the GBP-USD forex pair, especially if the actual figures deviate from the forecasts.
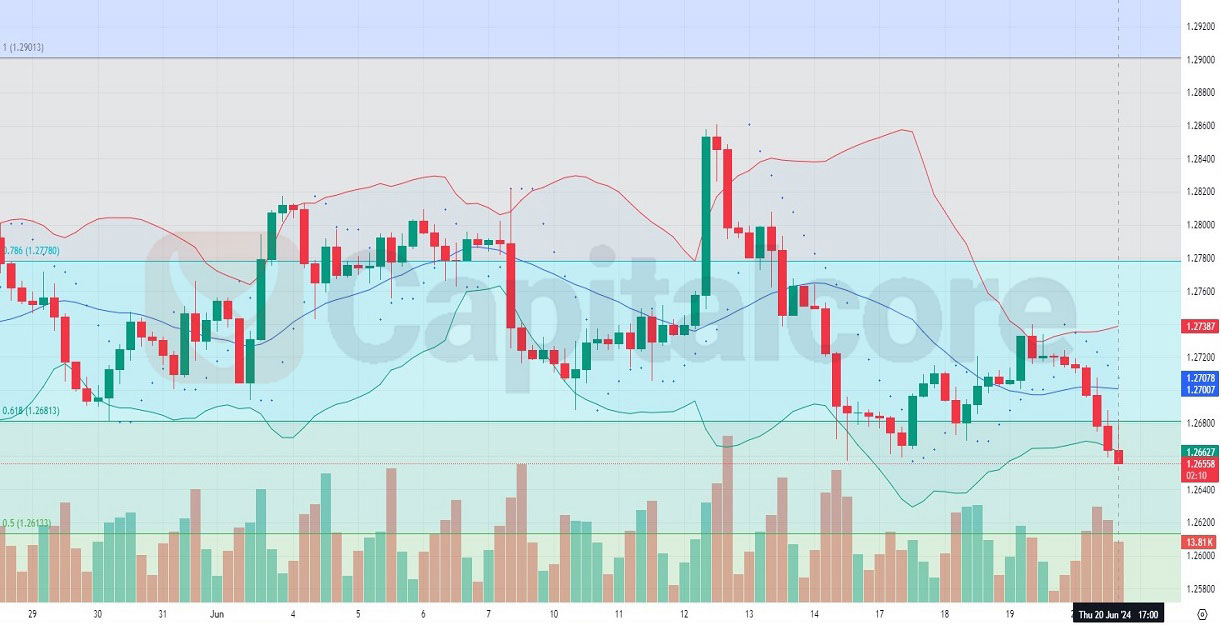
Chart Notes:
• Chart time-zone is UTC (+03:00)
• Candles’ time-frame is 4h.
Analyzing the GBP/USD H4 chart, several technical indicators provide insights into the pair’s recent bearish momentum. The Bollinger Bands show that the last seven red candles have moved from the upper band towards the middle band, with the last two candles touching the lower band, indicating strong bearish pressure. The bands are also widening smoothly, which usually signifies increasing volatility and the continuation of the current trend. The Parabolic SAR dots above the candles reinforce this bearish sentiment, showing no immediate signs of a reversal in the GBPUSD pair. Additionally, the Fibonacci Retracement levels indicate that the price is approaching key support areas. The increasing volume in the recent bearish candles suggests that the selling pressure is strong, which could lead to further declines if the support levels are breached.
• DISCLAIMER: Please note that the above analysis is not an investment suggestion by “Capitalcore Ltd”. This post has been published only for educational purposes.