Crucial Levels to Watch for Next Move
The BTC/USD pair has been trading within a well-defined bullish channel, as seen in the recent price action on the H4 chart. After a steady upward movement, the price has now entered a correction phase and is currently testing a key support zone near $63,273. This level represents a critical area to watch as the price approaches the lower bound of the ascending channel, offering a potential bounce-back point. Traders observing BTC price analysis and BTC/USD technical setups should note that the RSI is approaching neutral territory, suggesting that the recent bearish correction might be nearing its end.
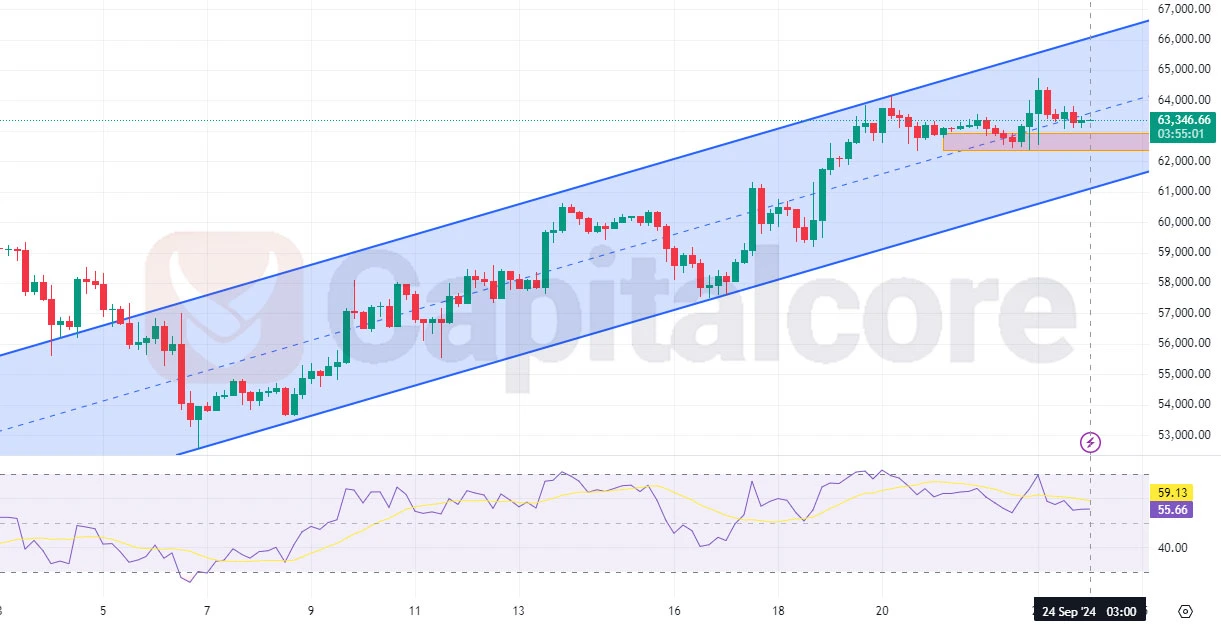
Chart Notes:
• Chart time-zone is UTC (+03:00)
• Candles’ time-frame is 4h.
From a technical perspective, a hold above this support zone could indicate a continuation of the broader bullish trend. Should BTC/USD maintain support at current levels, there is a strong possibility of further upward movement towards $66,000 and beyond. However, a break below the channel could trigger a deeper pullback. For those monitoring BTC exchange rates and seeking insights into BTC price forecasts, this critical juncture in the price movement offers significant opportunities for both bulls and bears alike. Stay vigilant for further developments as the market consolidates within this key price range.
• DISCLAIMER: Please note that the above analysis is not an investment suggestion by “Capitalcore LLC”. This post has been published only for educational purposes.