Analyzing USD/CAD Bullish Channel for Market Opportunities
The USDCAD forex pair, also known as the “Loonie,” is a popular trading pair that represents the exchange rate between the U.S. dollar (USD) and the Canadian dollar (CAD). The pair is influenced by crude oil prices due to Canada’s oil-exporting economy and by macroeconomic factors such as interest rates and GDP data. Today, traders are closely watching key economic releases from Canada, including the GDP m/m, Industrial Product Price Index (IPPI), and Raw Materials Price Index (RMPI). These reports will provide insights into Canada’s economic health, industrial pricing trends, and inflationary pressures. A better-than-expected GDP or IPPI reading could strengthen the CAD, leading to bearish pressure on the USD-CAD.
For the U.S. dollar, the CB Consumer Confidence report is a critical indicator of consumer sentiment and spending. A higher-than-forecasted reading could bolster USD strength, potentially offsetting CAD gains if Canadian data underperforms. The interplay between these news events will determine short-term price action, with a focus on risk sentiment, crude oil prices, and the relative strength of each currency.

Chart Notes:
• Chart time-zone is UTC (+02:00)
• Candles’ time-frame is 4h.
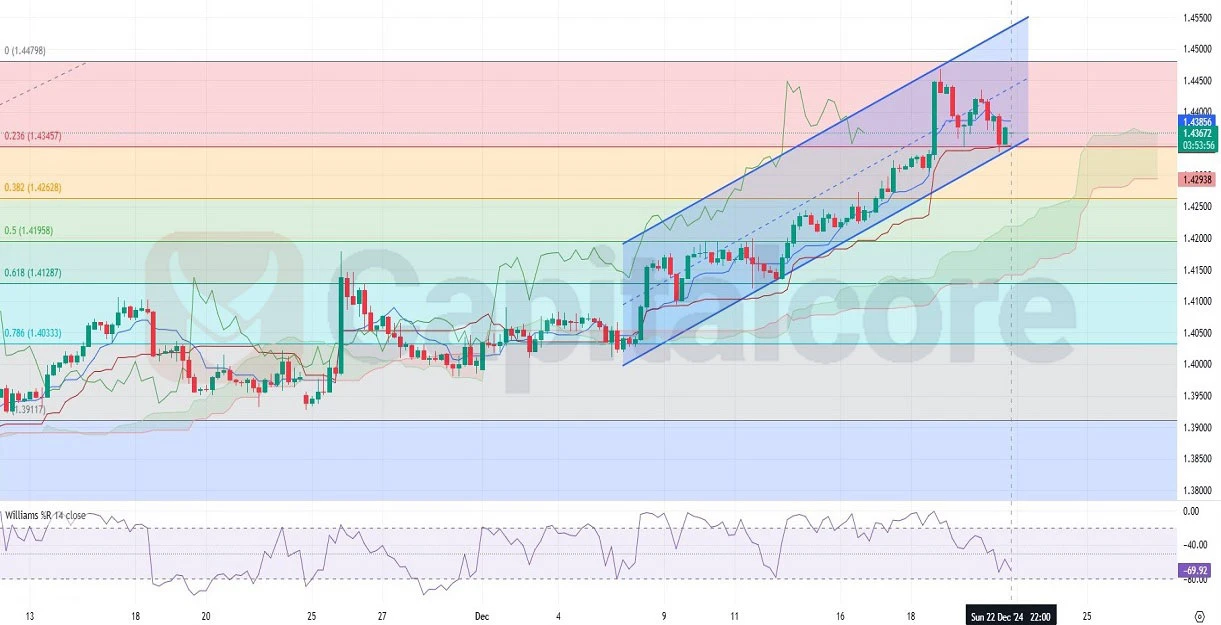
The H4 chart of USD/CAD shows a bullish trend with the price trading above the Ichimoku cloud, indicating strong upward momentum. The last two candles are bullish, suggesting a continuation of the uptrend, supported by the Williams %R14 indicator, which currently reads -69.92 close to oversold but still signaling potential bullish energy. The Fibonacci retracement levels highlight key areas of price action; the price recently rebounded from the 0.236 level after touching the 0.0 Fib level last week. The current move suggests a correction phase is ending, with price consolidating above support levels.
The bullish channel evident on the chart confirms the upward trend, though traders should monitor any breakouts or price reversals, especially around the Fibonacci levels. The continuation of bullish candles after the market’s reopening today hints at sustained bullish momentum in the short term.
DISCLAIMER: Please note that the above analysis is not an investment suggestion by “Capitalcore LLC”. This post has been published only for educational purposes.


