Gold Price Prediction XAUUSD Eyes New Highs
Gold (XAU/USD), often referred to as the “safe-haven asset” or “yellow metal,” remains a key instrument in forex trading, closely monitored by investors for its reaction to economic data, inflation, and geopolitical uncertainties. With its inverse correlation to the US dollar and bond yields, gold often serves as a hedge against inflation and market volatility. Today, gold traders are closely watching key economic events that could drive price action. The US Producer Price Index (PPI) and Core PPI reports will indicate inflationary trends, directly influencing Federal Reserve policy expectations. Additionally, a speech by Federal Reserve Governor Christopher Waller on stablecoins could hint at monetary policy sentiment, affecting USD strength. President Donald Trump’s press conference might introduce economic policy shifts, further impacting market risk sentiment. If PPI data exceeds forecasts, it may strengthen the USD, applying downward pressure on gold. Conversely, weaker-than-expected inflation figures may support further gold gains. Moreover, jobless claims data and the 30-year Treasury auction could impact market liquidity and investor risk appetite, reinforcing XAU/USD volatility.
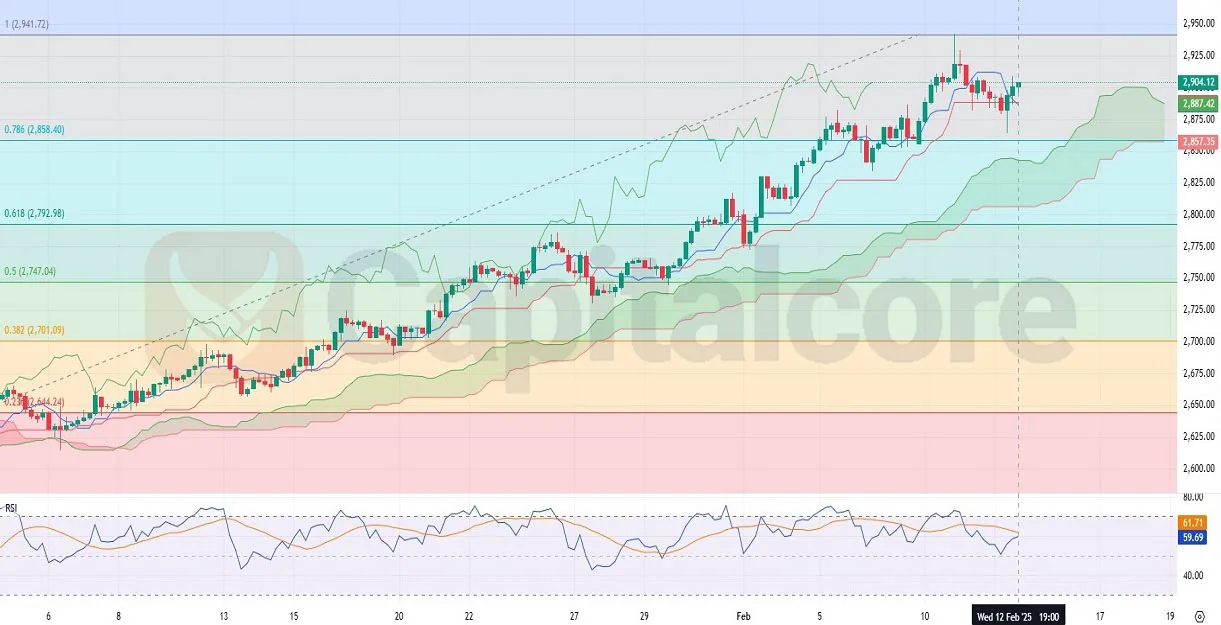
Chart Notes:
• Chart time-zone is UTC (+02:00)
• Candles’ time-frame is 4h.
The price of gold (XAU/USD) remains in a strong bullish trend, hovering near its recent all-time high (ATH). After experiencing a slight retracement, indicated by a series of red candles, the latest three candles have turned positive, reflecting renewed buying momentum. The Ichimoku Cloud remains green, and price action is well above the cloud, mirroring last month’s bullish trend and reinforcing the ongoing upward trajectory.
Additionally, the RSI indicator is trending higher, with the RSI line approaching the RSI moving average (MA) line, indicating strengthening bullish momentum. If the RSI breaks above the MA line, it could confirm further upside movement. Fibonacci retracement levels highlight key resistance near $2,941, while support is identified around $2,747 (0.5 level). If gold maintains its bullish momentum above these critical levels, a continuation towards new highs remains likely. However, any stronger-than-expected USD-related economic data could cause temporary pullbacks before another potential bullish move.
• DISCLAIMER: Please note that the above analysis is not an investment suggestion by “Capitalcore LLC”. This post has been published only for educational purposes.
