How High Can XAUUSD Go Next?
Gold (XAU/USD), also known as the “yellow metal,” is a highly sought-after asset in forex trading, often serving as a safe-haven investment during times of economic uncertainty. As one of the most liquid commodities, GOLD price action is closely linked to macroeconomic data, inflation trends, and central bank policies. Today, GOLD/USD’s movement will be influenced by the University of Michigan Consumer Sentiment and Inflation Expectations reports, which are key indicators of economic confidence and future inflation trends. If these reports show stronger-than-expected results, the U.S. dollar (USD) may strengthen, potentially leading to a pullback in GOLD prices. However, if consumer confidence and inflation expectations come in weaker, GOLD could continue its bullish rally, as traders seek safe-haven assets amid economic uncertainty. With inflation concerns still present, GOLD remains a key hedge against currency devaluation, and its price action is expected to react sharply to the data release.
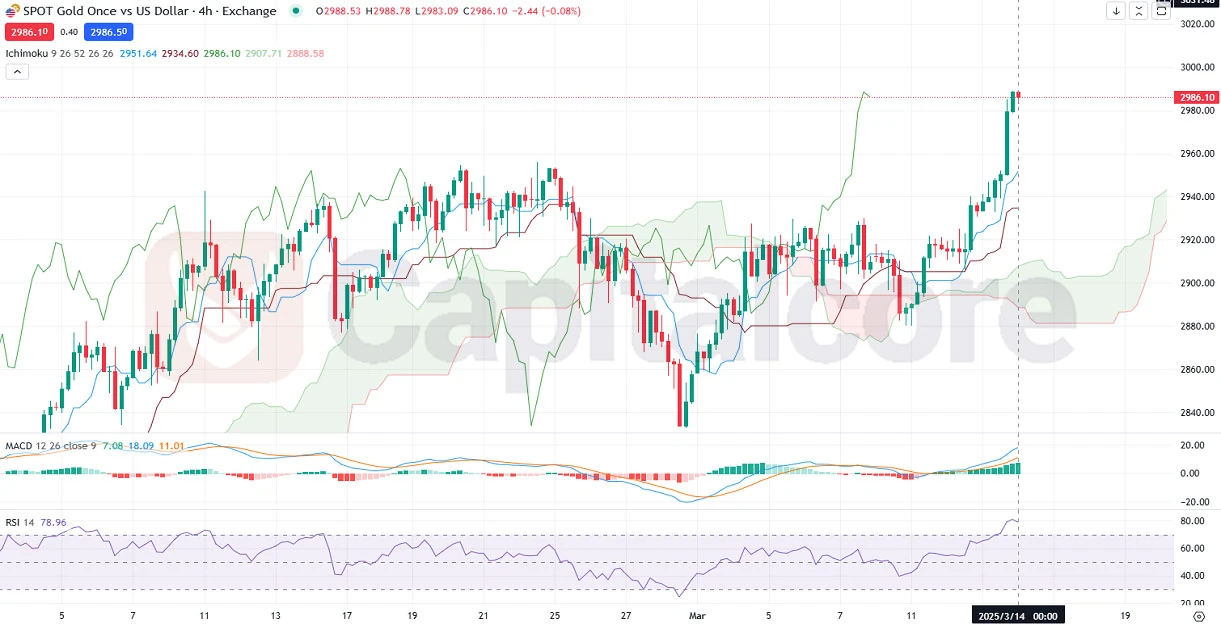
Chart Notes:
• Chart time-zone is UTC (+02:00)
• Candles’ time-frame is 4h.
The GOLD/USD (XAUUSD) H4 chart shows a strong bullish continuation, with GOLD recently recording a new all-time high (ATH). The price action is characterized by sharp bullish candles moving significantly above the Ichimoku Cloud, indicating strong momentum and an established uptrend. The Ichimoku cloud itself has tightened, but both the upper and lower boundaries are trending upwards, further reinforcing bullish strength. Additionally, momentum indicators confirm the ongoing bullish sentiment. The MACD and its histogram show increasing bullish momentum, with the MACD line widening its gap above the signal line. The RSI has surged above 78, signaling overbought conditions, which could lead to temporary pullbacks or consolidation before another leg higher. Given this price action setup, traders should watch for potential retracements towards key support levels near $2,950 before a continuation of the uptrend. However, a break below the cloud could indicate a shift in momentum.
• DISCLAIMER: Please note that the above analysis is not an investment suggestion by “Capitalcore LLC”. This post has been published only for educational purposes.


