Forex Analysis of AUDUSD on H4 Chart
The AUD USD, known popularly as the “Aussie,” is a major forex pair representing the Australian dollar against the US dollar. It is favored by traders for its strong correlation to commodity prices and market sentiment. Today, fundamental factors for AUD-USD include the Melbourne Institute (MI) Westpac Leading Index from Australia, with higher-than-forecast results likely supporting the Australian dollar. On the US side, traders will closely monitor crude oil inventories from the Energy Information Administration (EIA), Fed Interest Rate decisions, the FOMC statement, economic projections, and the Fed Chair’s press conference, all of which can heavily influence USD strength. A hawkish stance or reduced crude inventories could boost the USD, creating volatility in the AUD vs USD pair.
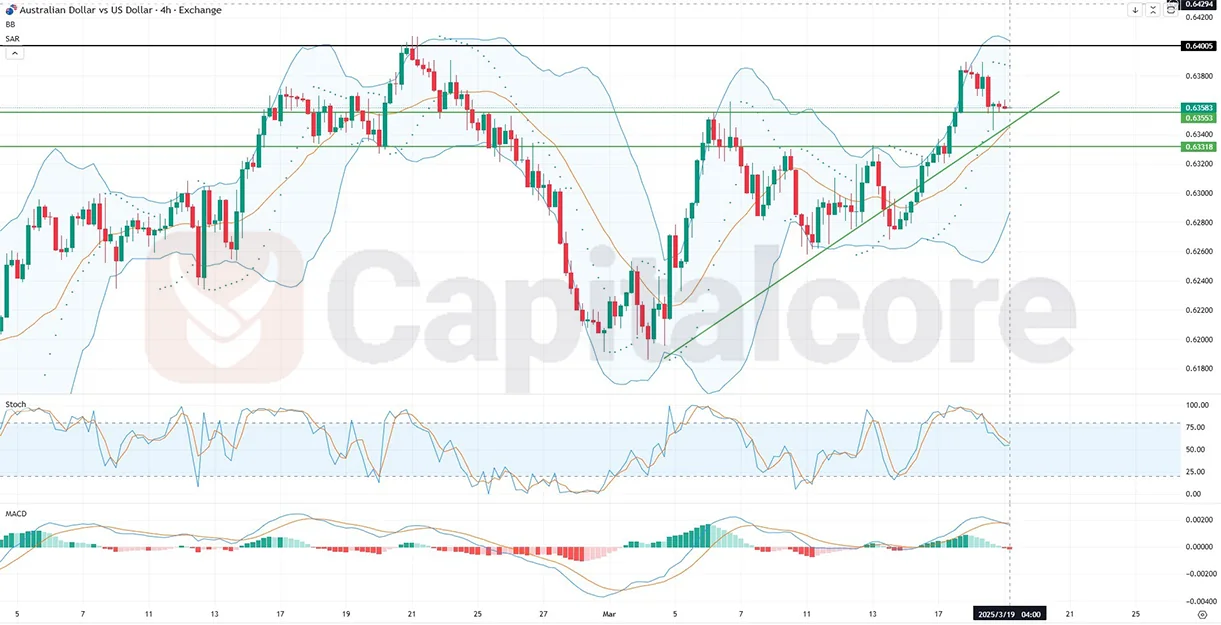 Chart Notes:
• Chart time-zone is UTC (+02:00)
• Candles’ time-frame is 4h.
Analyzing the AUD-USD H4 chart, the price action has clearly broken through the resistance zone at 0.63553 and recently retested this level as support. This pullback indicates a possible continuation upward if the price can sustain above this critical zone. Should the price fail to hold above this newly established support, it could retrace down towards the ascending trendline and further to the key support level at 0.63318. The Stochastic oscillator shows decreasing bullish momentum and is trending downward, indicating potential short-term bearish pressure. Additionally, the MACD indicator suggests bearish sentiment, as it has recently produced a bearish crossover, signaling potential downward price action in the immediate short-term.
• DISCLAIMER: Please note that the above analysis is not an investment suggestion by “Capitalcore LLC”. This post has been published only for educational purposes.
