AUD/USD Forecast After Richmond Fed Manufacturing Data
The AUD-USD forex pair, also known as the “Aussie,” is one of the major currency pairs heavily traded globally, reflecting the exchange rate between the Australian dollar and the US dollar. Its price movements are significantly influenced by interest rate differentials set by the Reserve Bank of Australia (RBA) and the Federal Reserve (Fed), alongside commodity prices and economic performance. Fundamentally, traders are closely monitoring today’s scheduled release of the RBA meeting minutes, which might reveal further insights into Australia’s economic outlook and potential interest rate decisions. A more hawkish tone than expected in the RBA minutes could strengthen the Australian dollar. Conversely, traders will also focus on the Federal Reserve Chair Jerome Powell’s speech today, as any hawkish signals concerning US monetary policy can potentially boost the US dollar. Additionally, the Richmond Fed Manufacturing Index release may further influence short-term price action based on manufacturing sentiment in the US.
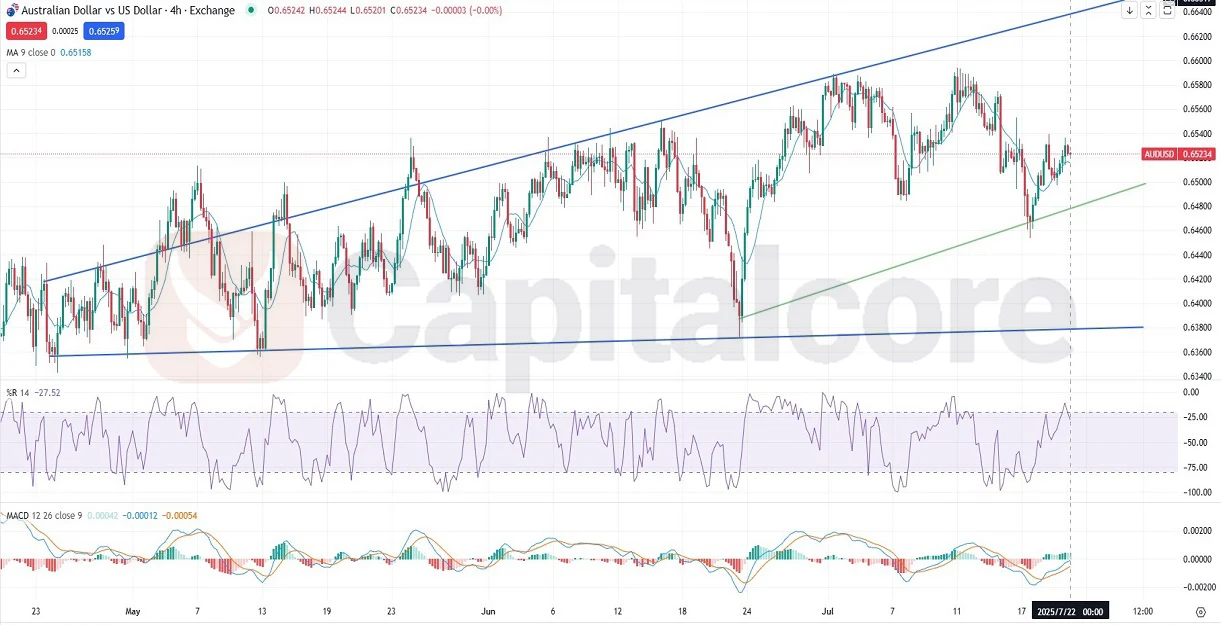
Chart Notes:
• Chart time-zone is UTC (+03:00)
• Candles’ time-frame is 4h.
Analyzing the AUD/USD 4-hour (H4) chart, despite the sideway trend of the candles, it appears they are shaping an opening wedge pattern. Although recent candles indicate upward momentum, the last two red candles might signal a potential reversal or downtrend. Should the bearish sentiment intensify, breaking the support line, we may expect the price action to move towards the wedge’s lower boundary. Alternatively, sustained bullish momentum could push the candles towards the wedge’s upper boundary. The 9-period Moving Average (MA 9), despite the recent bearish candles, remains positioned below the candlesticks, suggesting potential support. Meanwhile, the Williams %R indicator has declined to the -26.86 level, indicating weakening bullish strength. The MACD histogram is currently green, at 0.00046, with the MACD line at -0.00004 above the signal line positioned at -0.00056, reflecting a mildly bullish bias but also potential convergence towards bearishness.
•DISCLAIMER: Please note that the above analysis is not an investment suggestion by “Capitalcore LLC”. This post has been published only for educational purposes.