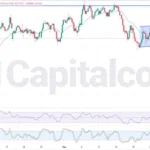
FTSE 100 Ascending Channel Signals Possible Correction
The UK100, commonly known as the FTSE 100, is a benchmark index that represents the 100 largest companies listed on the London Stock Exchange, serving as a barometer for the UK’s economic health. Traders often refer to it by its nickname, “Footsie.” Fundamentally, today’s focus is on the upcoming releases of the Purchasing Managers’ Index (PMI) for both the manufacturing and services sectors, along with the CBI Industrial Trends Survey. A PMI reading above the forecast will likely strengthen investor confidence, indicating economic expansion and potentially supporting bullish momentum. Conversely, figures below expectations could indicate economic weakness and trigger bearish sentiment or corrections in the FTSE 100 index.
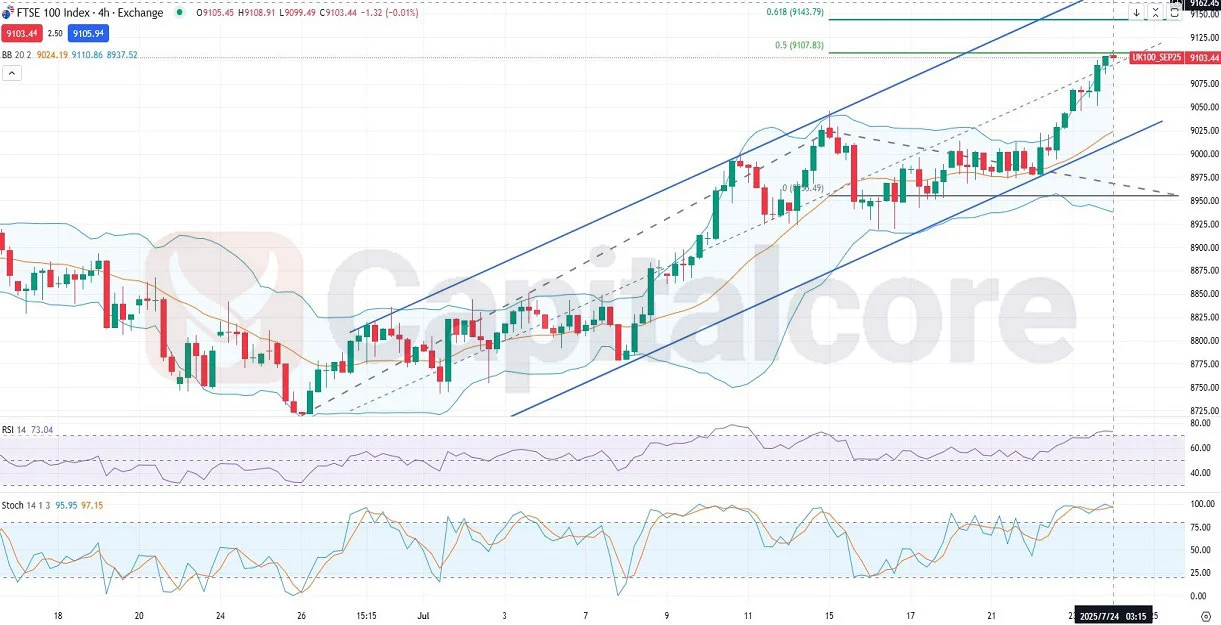
Chart Notes:
• Chart time-zone is UTC (+03:00)
• Candles’ time-frame is 4h.
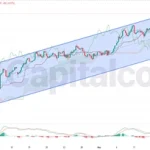
Technically, the UK100 H4 chart shows price action currently moving within an ascending channel, recently reacting around the middle band. The recent higher high formation and proximity to the Fibonacci extention level of 0.5 suggest a potential nearing correction phase. Bollinger Bands have started expanding with the price above the middle band, indicating increased volatility and potential reversal signals. The RSI indicator at around 73 is in the overbought territory, hinting at the likelihood of a corrective pullback. Additionally, the Stochastic oscillator further confirms an overbought condition, with the K% line at around 97 and the D% line at around 96, suggesting an impending downside adjustment.
•DISCLAIMER: Please note that the above analysis is not an investment suggestion by “Capitalcore LLC”. This post has been published only for educational purposes.