BTCUSD H4 Chart Analysis Bullish Trend Correction
The BTC/USD pair, commonly known as Bitcoin, remains one of the most actively traded forex pairs globally, often referred to as digital gold due to its volatility and prominence as a cryptocurrency benchmark. Today, the BTC/USD price action will be influenced by several crucial economic data points from the US, including Challenger Job Cut Announcements, ADP Employment Change, Initial Jobless Claims, Labor Productivity, and Non-Manufacturing PMI, all indicative of the overall economic health and thus highly impactful on the USD. Positive outcomes, indicating economic growth or recovery, would typically strengthen the USD, potentially creating downward pressure on BTC/USD, while weaker-than-expected data could provide bullish momentum for Bitcoin.
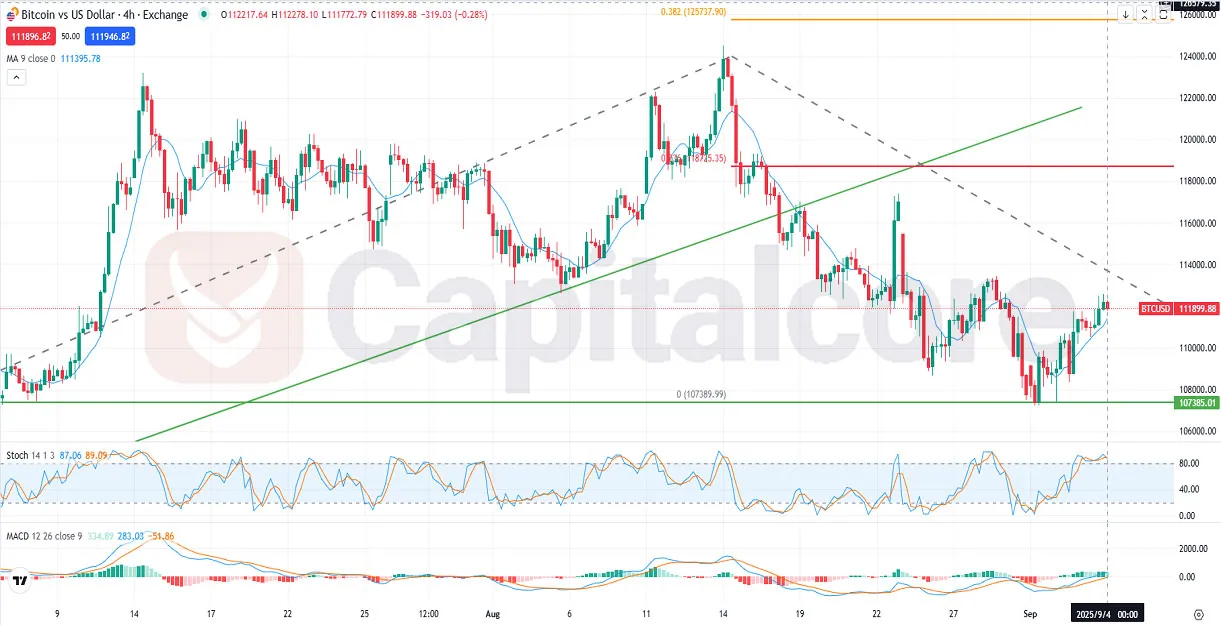
Chart Notes:
• Chart time-zone is UTC (+03:00)
• Candles’ time-frame is 4h.
Analyzing the BTC/USD H4 chart provided, the pair has been exhibiting a long-term bullish trend, recently undergoing a corrective phase breaking the previous support line and currently rebounding toward bullish momentum. According to Fibonacci extension levels, the BTC/USD price candles are projected to rise towards at least the 0.236 Fibonacci extension level. Should the momentum reverse, the price action could test the significant support at 107385.01. The current BTC/USD price remains above the 9-period moving average, indicating bullish sentiment in short-term price action. The Stochastic indicator signals potential overbought conditions, with the %K line at 87.06 and the %D line at 89.09, suggesting caution for buyers. The MACD histogram at 334.89 confirms bullish momentum with the MACD line at 283.03, significantly above the signal line at -51.86, indicating continuing upward potential.
•DISCLAIMER: Please note that the above analysis is not an investment suggestion by “Capitalcore LLC”. This post has been published only for educational purposes.