Outlook for Kiwi Dollar H4 Gains
NZD/USD, often referred to as the “Kiwi,” represents the pairing of the New Zealand dollar and the U.S. dollar, reflecting the economic relationship between New Zealand and the United States. The Kiwi is closely tied to tourism and commodity flows, making it sensitive to shifts in global risk sentiment. On the New Zealand side, today’s focus will be on International Travel and Migration data from Statistics New Zealand, a key measure of overseas visitor arrivals; stronger-than-expected numbers would be supportive for the NZD given tourism’s significant contribution to employment and GDP. Meanwhile, the U.S. side offers a packed calendar, with the Producer Price Index (PPI) and Core PPI reports from the Bureau of Labor Statistics providing important insights into inflation trends—higher readings could bolster the dollar by reinforcing expectations of tighter monetary policy. Additionally, traders will monitor weekly crude oil inventory data from both the American Petroleum Institute (API) and the Energy Information Administration (EIA), as well as the upcoming U.S. Treasury auction results, all of which could sway USD sentiment depending on market reactions.
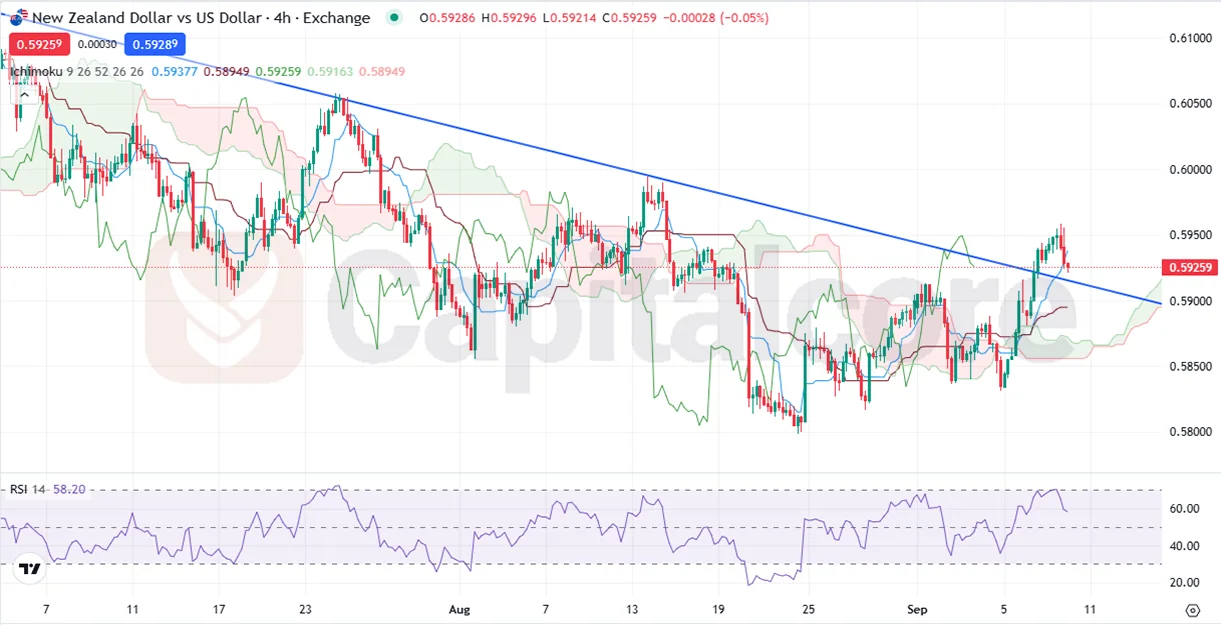 Chart Notes:
• Chart time-zone is UTC (+03:00)
• Candles’ time-frame is 4h.
Technically analyzing the NZD/USD H4 chart, the pair has recently broken above its established bearish trend line, signaling a potential shift in momentum. Price action has also moved above the Ichimoku cloud, which strengthens the case for a bullish reversal after the prior bearish wave. The breakout suggests that buyers are regaining control, with the cloud now serving as an initial support area should price retest lower levels. Meanwhile, the RSI is trending higher, indicating building bullish momentum, though traders should remain cautious of overbought conditions if the indicator pushes toward extreme levels. Overall, the technical setup favors continued upward movement, with potential for further gains if the pair holds above the cloud and sustains its break from the downtrend structure.
•DISCLAIMER: Please note that the above analysis is not an investment suggestion by “Capitalcore LLC”. This post has been published only for educational purposes.