Fed Speakers Drive US500 Fundamental Trading Outlook
The S&P 500 index, also known as US500 in forex trading, is a major benchmark representing the performance of 500 large-cap U.S. companies. Often referred to as the “SPX” in financial circles, it reflects investor sentiment and economic outlook across sectors, making it a key asset for traders analyzing daily price action and macroeconomic trends. Today’s US500 fundamental analysis focuses on the upcoming USD news events, with several key speeches by FOMC voting members scheduled. Federal Reserve officials, including Mary Daly, Austan Goolsbee, and Alberto Musalem, are expected to deliver remarks on monetary policy, economic outlook, and inflation expectations. With rising speculation around future interest rate paths, any hawkish tone from these speakers could bolster the U.S. dollar and pressure the US500. Additionally, the University of Michigan’s consumer sentiment and inflation expectations reports will offer further insights into consumer confidence and potential inflation trends. A stronger-than-expected outcome may raise concerns about persistent inflation, leading to speculation of tighter Fed policy—potentially triggering downward pressure on equities. Therefore, traders should stay alert for volatility spikes and shifts in market sentiment based on today’s economic commentary and data releases.
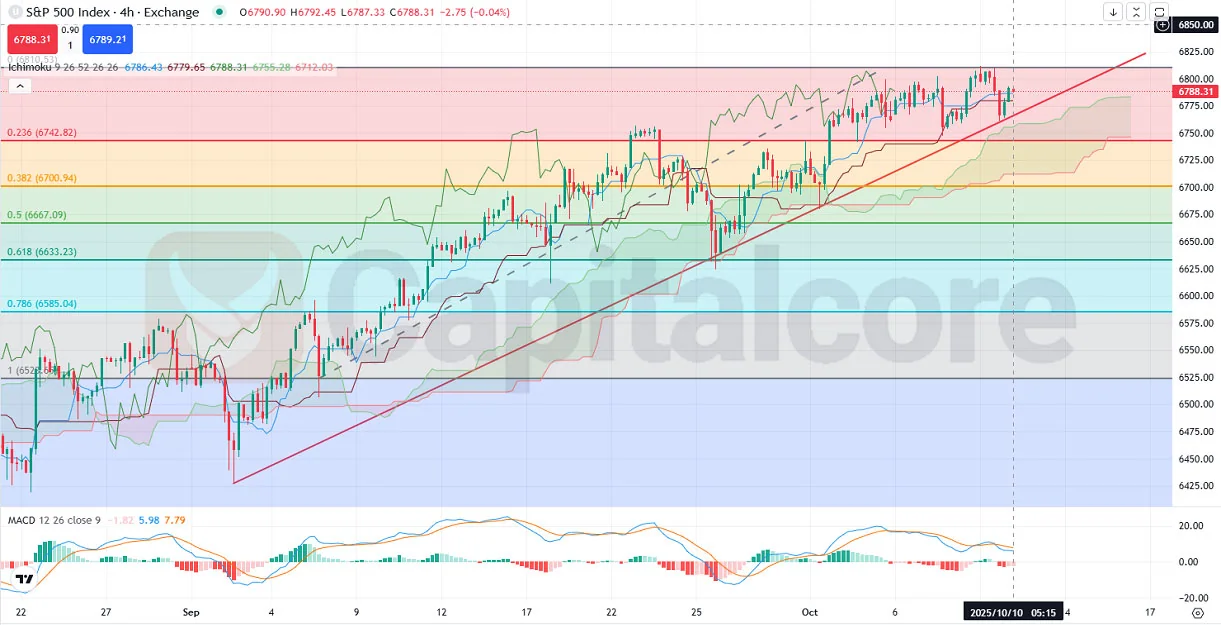
Chart Notes:
• Chart time-zone is UTC (+03:00)
• Candles’ time-frame is 4h.
From a technical analysis perspective on the US500 H4 chart, the index is currently maintaining its bullish momentum within an ascending price channel, as it continues to respect the upward-sloping trendline that has acted as support multiple times. The price is moving firmly above the Ichimoku Cloud, indicating strong bullish sentiment, and it is currently trading between the 0.236 and 0 Fibonacci levels, which represent a critical zone of consolidation and potential breakout. The Ichimoku’s leading span lines are also sloping upward, supporting the bullish case. The MACD line remains above the signal line, though the histogram is slightly contracting, suggesting momentum is slowing and a potential short-term consolidation or pullback could be in play before another leg higher. As long as price stays above the cloud and trendline, the technical bias remains bullish. However, any breakdown below the trendline or a bearish MACD crossover could signal a change in direction, especially if reinforced by fundamental data.
•DISCLAIMER: Please note that the above analysis is not an investment suggestion by “Capitalcore LLC”. This post has been published only for educational purposes.