UK100 Bulls Hesitate as MACD and RSI Signal Correction
The UK100 index, widely known as the FTSE 100 or “Footsie,” represents the 100 largest companies listed on the London Stock Exchange by market capitalization, making it a prominent indicator of the UK’s economic health and investor sentiment. Today’s upcoming fundamental news from the Eurozone, including GDP preliminary estimates and consumer price index (CPI) reports from major economies like Germany, France, and Italy, is critical as strong economic indicators in Europe often positively impact UK businesses, especially those with significant EU exposure. Furthermore, today’s ECB interest rate decision and press conference will likely introduce considerable volatility, with any hawkish tones potentially benefiting the GBP and indirectly influencing the UK’s largest listed companies, thus impacting UK100’s price movements.
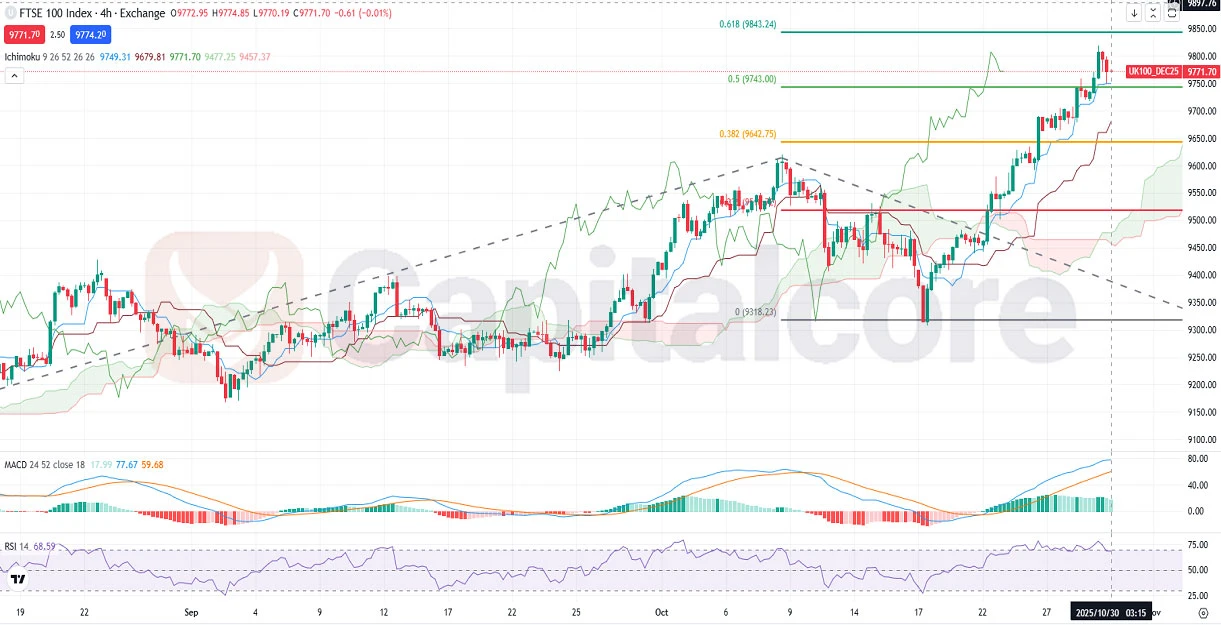
Chart Notes:
• Chart time-zone is UTC (+02:00)
• Candles’ time-frame is 4h.
Analyzing the UK100 H4 chart, we observe a clear bullish momentum recently, with a sharp upward price action after the latest corrective phase. However, as the candles approach the critical Fibonacci extension level at 0.618 (9843.24), there’s evident bearish price action emerging, suggesting a potential correction phase. The nearest support appears to be the Fibonacci extension at 0.5 (9743.00), aligning with Ichimoku cloud indicators at 9749.31 and 9679.81, thus reinforcing this region’s significance as a strong support zone. MACD at 17.99 and RSI approaching the overbought territory at 68.59 confirm the likelihood of a pullback, indicating traders should watch closely for possible bearish signals and corrective price actions.
•DISCLAIMER: Please note that the above analysis is not an investment suggestion by “Capitalcore LLC”. This post has been published only for educational purposes.