BTCUSD Bollinger Bands and Indicator Setup
Bitcoin vs US Dollar, often called “Digital Gold,” represents the most traded crypto-fiat pair and serves as a key indicator of global risk sentiment. Today’s fundamental outlook centers on several high-impact US data releases including the S&P Global and ISM Manufacturing PMIs, ISM Prices Paid, Construction Spending, and Wards Auto Sales. Strong results could reinforce expectations of persistent inflation and a hawkish Federal Reserve, boosting the USD and pressuring Bitcoin. However, dovish remarks from FOMC members Mary Daly and Lisa Cook, or weaker manufacturing and spending data, may soften the dollar and support BTC/USD as investors shift toward risk assets. Market sentiment will hinge on how these reports shape rate expectations and economic confidence.
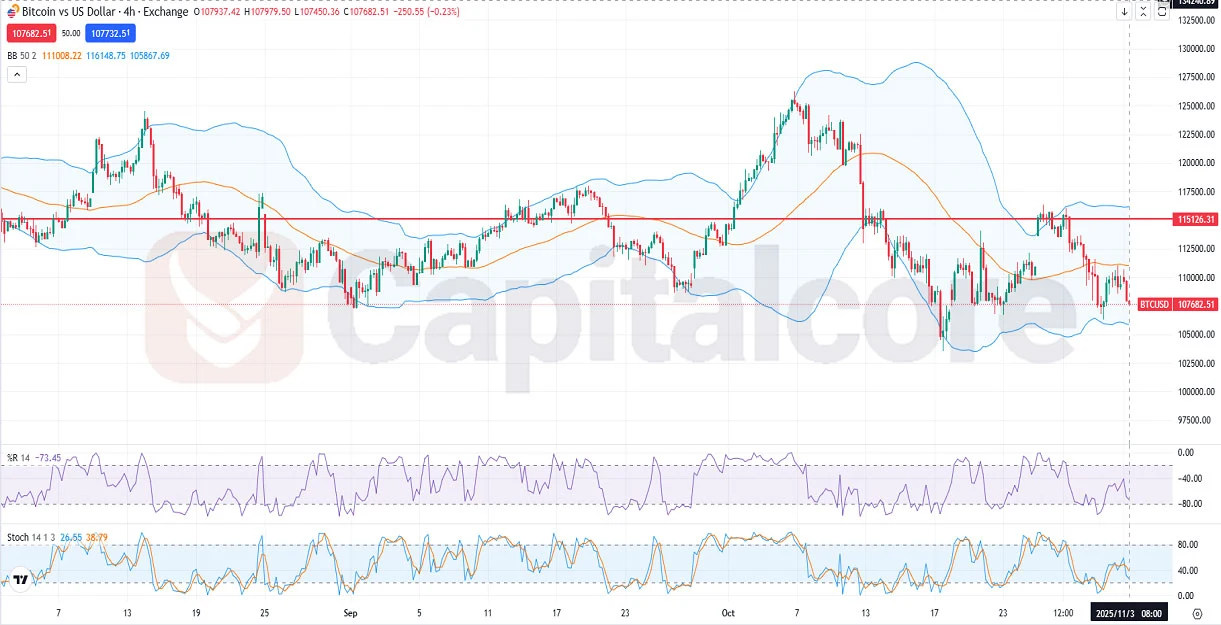
Chart Notes:
• Chart time-zone is UTC (+02:00)
• Candles’ time-frame is 4h.
Technically, the BTC/USD H4 chart shows a volatile, sideways market, with the pair forming both higher highs and lower lows. The candles remain generally bullish, though recent bearish momentum may lead to a short-term dip before recovery. The Bollinger Bands (50) indicate narrowing volatility and the possibility of an upcoming breakout. The Williams %R (14) at -73.45 shows the pair nearing oversold conditions, while the Stochastic (26.55 and 38.79) suggests an approaching bullish crossover. These readings imply a likely rebound toward the 115126.31 resistance level, should buying pressure return following today’s economic events.
•DISCLAIMER: Please note that the above analysis is not an investment suggestion by “Capitalcore LLC”. This post has been published only for educational purposes.