MACD Signals Mild Bearish Momentum on USDJPY Today
The USD/JPY pair, popularly known as “the Gopher,” represents the value of the U.S. dollar (USD) against the Japanese yen (JPY). This major forex pair is highly sensitive to economic indicators and monetary policy statements from both the U.S. Federal Reserve and the Bank of Japan (BOJ). Today’s fundamental outlook is shaped by the Bank of Japan’s projections on inflation and economic growth, which tend to significantly impact the yen. A more hawkish stance by the BOJ, indicating tightening monetary policies, typically strengthens the yen. Simultaneously, U.S. data releases, including pending home sales and crude oil inventories, could influence the dollar’s valuation, impacting USD/JPY dynamics. Investors should monitor these releases closely for indications of economic health and market sentiment.
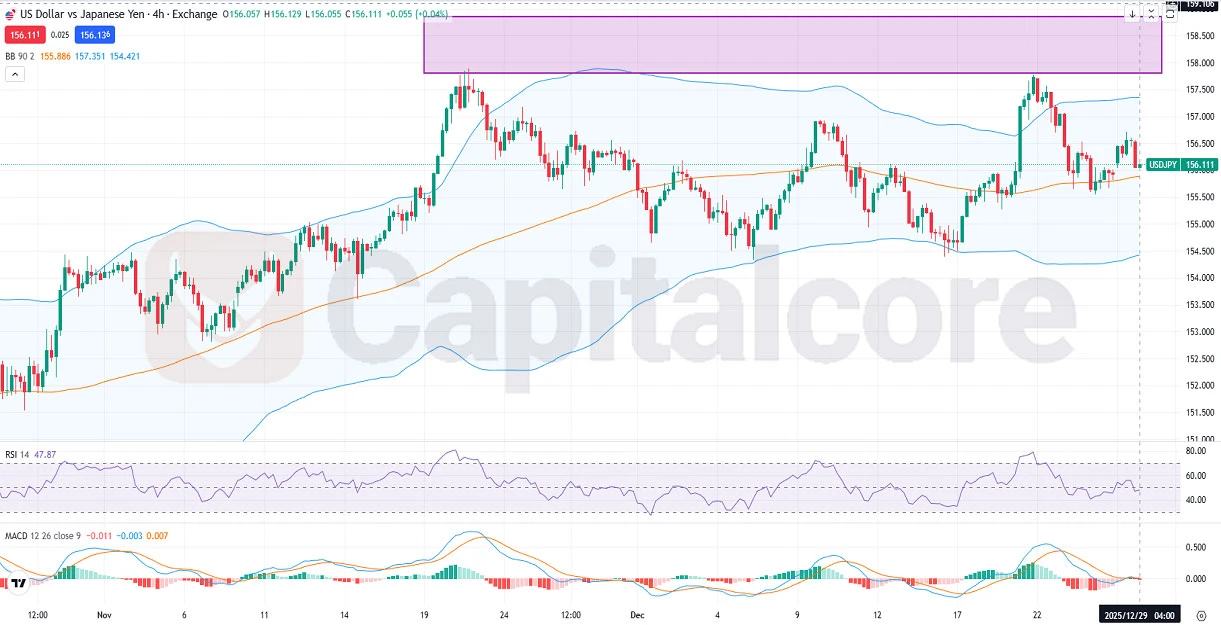
Chart Notes:
• Chart time-zone is UTC (+02:00)
• Candles’ time-frame is 4h.
Technical analysis of the USD/JPY H4 chart shows that the price action has recently approached a historically significant resistance zone from which a bearish trend previously originated. The candles have twice touched this zone, displaying a sideways market pattern, indicating insufficient bullish momentum to breach resistance. Currently, candles are trending upward toward their recent high, suggesting potential downward movement thereafter. The Bollinger Bands (90) have expanded and are expected to narrow, implying a forthcoming consolidation period. The RSI (14) indicator at 47.87 indicates neutral momentum, neither overbought nor oversold. Meanwhile, the MACD (12,26,9) readings of -0.011, -0.003, and 0.007 suggest mild bearish momentum and cautious sentiment among traders.
•DISCLAIMER: Please note that the above analysis is not an investment suggestion by “Capitalcore LLC”. This post has been published only for educational purposes.