UK100 Price Action Analysis Daily Chart Bullish Trend Confirmation
The UK100, also widely known as the FTSE 100, represents the 100 most capitalized companies listed on the London Stock Exchange, serving as a key indicator of economic health in the UK. Fundamentally, traders today will closely observe critical data releases from the Bank of England, including the money supply, mortgage approvals, and consumer credit figures. Positive data exceeding forecasts would signal enhanced consumer confidence and economic stability, potentially reinforcing investor optimism and adding upward momentum to the UK100 index.
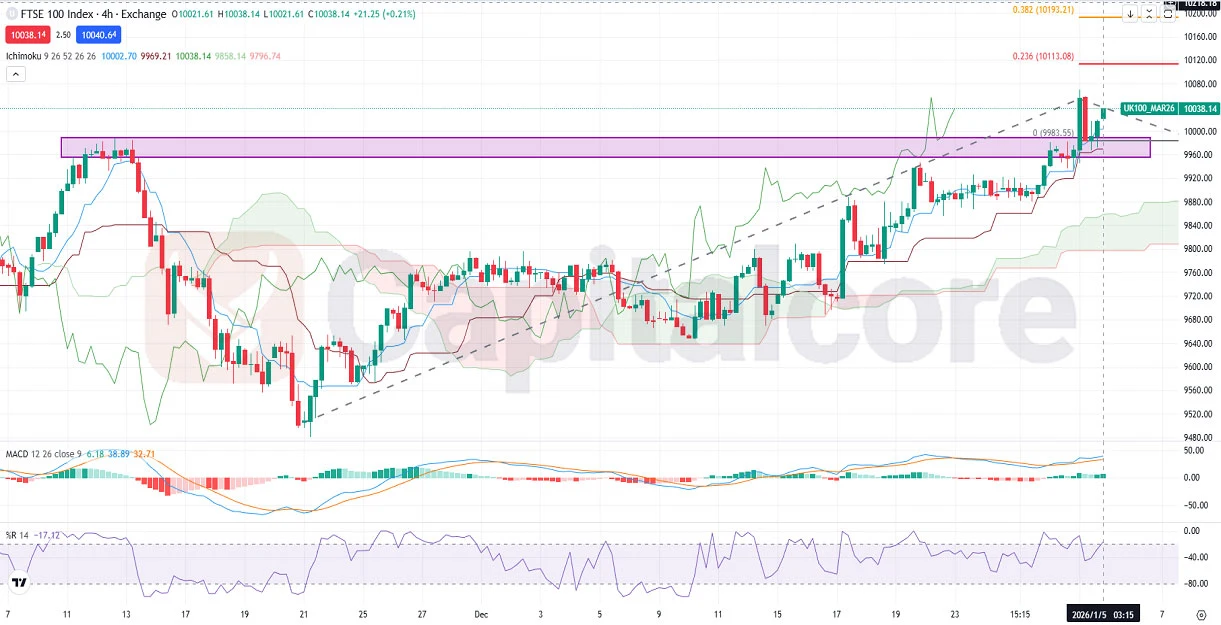
Chart Notes:
• Chart time-zone is UTC (+02:00)
• Candles’ time-frame is 4h.
Analyzing the UK100 H4 chart, it’s clear that the index has been experiencing a bullish trend characterized by strong upward momentum. The recent breakout above the previous significant high with a brief pullback suggests potential for continuation of the bullish trend. Given the current price action and technical indicators—William’s %R at -17.12 signaling overbought yet bullish sentiment, MACD remaining positively oriented (6.18, 38.89, 32.71), and Ichimoku values supportive of further upward movement—the bullish trend seems poised to persist. If bullish momentum continues, the Fibonacci extension level at 0.236 (10113.08) emerges as the next potential target for the index.
•DISCLAIMER: Please note that the above analysis is not an investment suggestion by “Capitalcore LLC”. This post has been published only for educational purposes.