Forex Analysis AUDUSD Trend Reversal Insights
AUD/USD, commonly known as the “Aussie,” is one of the most actively traded forex pairs, comprising the Australian Dollar and the US Dollar. Today’s upcoming news highlights the Australian Monthly Household Spending Indicator (MHSI), expected to significantly influence the AUD, as positive consumer spending reflects economic strength and can provide bullish support. Simultaneously, traders should closely monitor Federal Reserve Bank of Richmond President Thomas Barkin’s speech, as hawkish commentary typically strengthens the USD, creating potential volatility for AUD/USD.
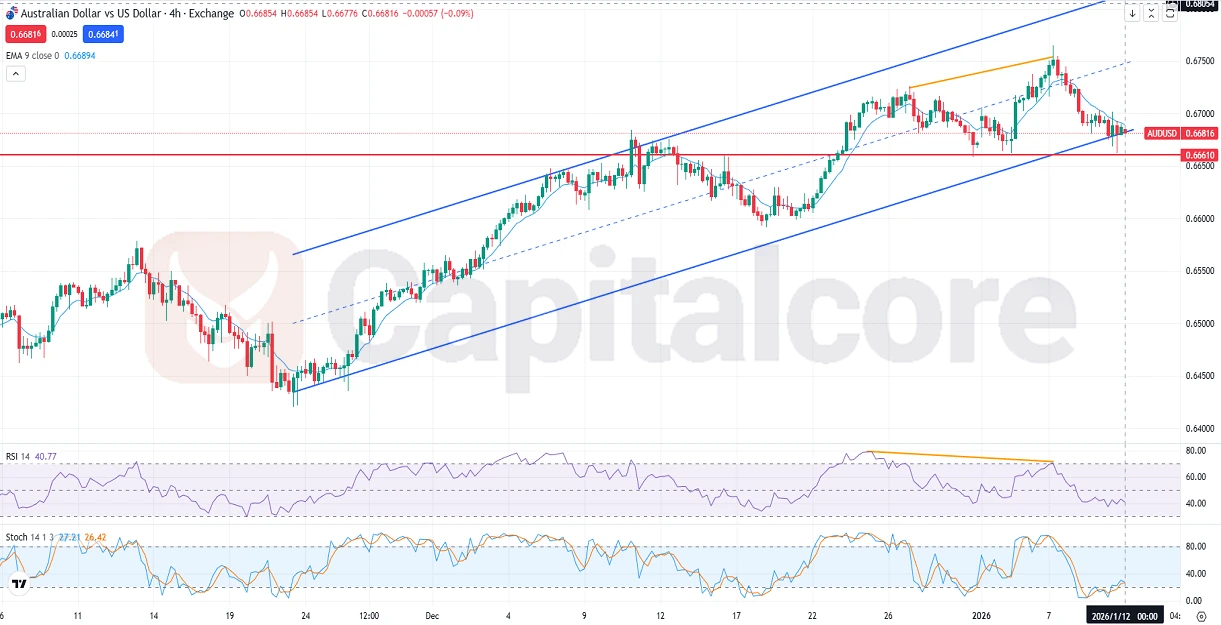
Chart Notes:
• Chart time-zone is UTC (+02:00)
• Candles’ time-frame is 4h.
Analyzing the AUD/USD H4 chart, the pair has experienced sharp bullish momentum within an ascending channel. However, recent bearish divergence hints at a possible trend reversal towards bearishness. The candles are currently testing the lower boundary of the bullish channel, and a decisive breach might target the 0.66610 support level initially. Conversely, if the bullish sentiment resumes, price action could aim towards the midline of the channel. Indicators align with cautious market sentiment: EMA (9) currently lies above the candles, signifying bearish pressure. The RSI (14) at 40.77 indicates weakening momentum without yet signaling oversold conditions. Meanwhile, the Stochastic (14,1,3) at 27.21 and 26.42 similarly supports bearish bias, suggesting the current bearish momentum could persist.
•DISCLAIMER: Please note that the above analysis is not an investment suggestion by “Capitalcore LLC”. This post has been published only for educational purposes.