Bitcoin Fundamental Outlook PPI Delays and USD Market Volatility
The BTC/USD pair, widely known as “Digital Gold” or simply “The King of Crypto,” represents the exchange rate between Bitcoin and the US Dollar. As the premier cryptocurrency forex pair, it serves as a primary benchmark for the digital asset market’s health and global risk sentiment. Fundamentally, Bitcoin is currently navigating a high-volatility environment driven by significant delays in US economic data due to the government shutdown, which has postponed key reports like the PPI and Retail Sales for months. This “data fog” forces investors to rely on hawkish or dovish clues from a flurry of Federal Reserve speakers scheduled for today, including Presidents Paulson, Bostic, and Kashkari. While the delayed PPI and Retail Sales data normally serve as primary gauges for inflation and consumer spending, the current lack of transparency in traditional markets is positioning Bitcoin as a sophisticated macro hedge. Traders are closely monitoring the USD’s strength, as any signs of economic instability arising from the prolonged shutdown or hawkish Fed rhetoric could further catalyze BTC/USD price action as a safe-haven alternative.
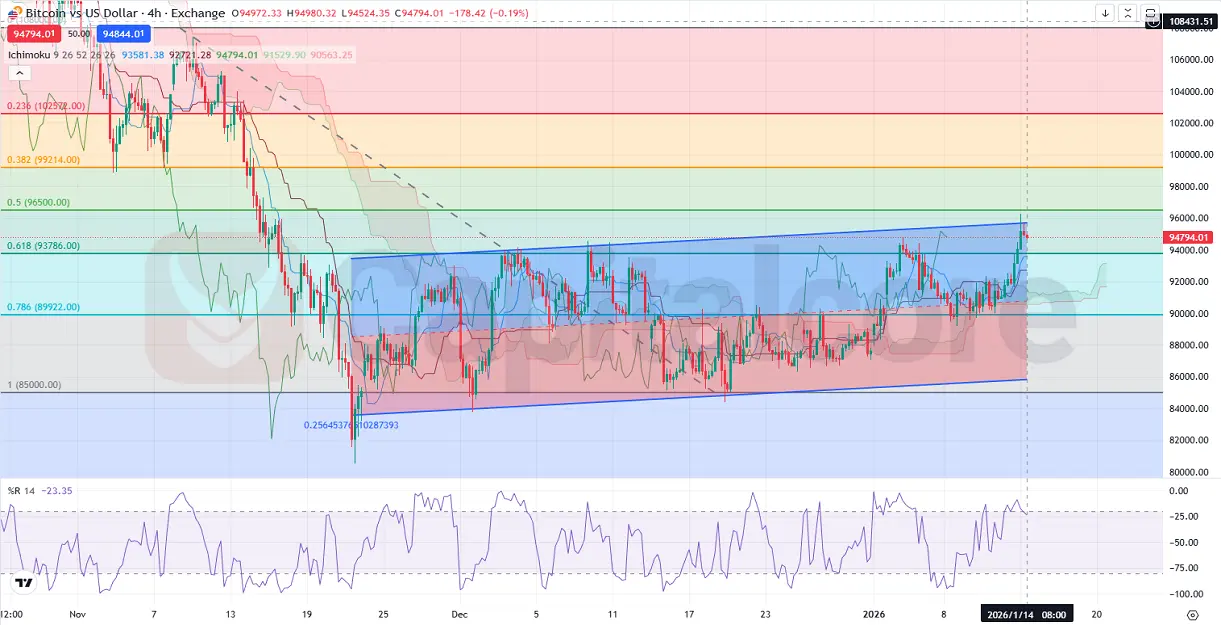
Chart Notes:
• Chart time-zone is UTC (+02:00)
• Candles’ time-frame is 4h.
The BTC/USD H4 chart shows a constructive technical structure as the price recently touched the 95K and 96K resistance zones, effectively reaching the 0.5 Fibonacci retracement level. Currently, the pair is hovering around the 95K mark, consolidating between the 0.5 and 0.618 Fibonacci levels, which suggests a healthy “breather” after the New Year rally. The price action remains bullish as it trades above the Ichimoku Cloud, with the Leading Span A moving above Leading Span B. Although the green cloud remains intact, both spans have begun to flatten horizontally following two recent red candles, indicating a temporary pause in momentum. Crucially, the Regression Channel’s middle line has successfully acted as a dynamic support level, preventing a dip below the 90K psychological floor. With the %R indicator sitting at -23.35, the pair is approaching overbought territory but still has room for a final push toward the 100K milestone if the horizontal consolidation resolves to the upside.
•DISCLAIMER: Please note that the above analysis is not an investment suggestion by “Capitalcore LLC”. This post has been published only for educational purposes.