Technical Analysis of UK100 H4 RSI and Stochastic
The UK100, nicknamed the “Footsie,” tracks the 100 largest blue-chip companies on the London Stock Exchange and serves as the primary benchmark for the British economy. Fundamentally, the index is facing volatility as traders await critical CPI and PPI inflation data from the ONS; a higher-than-forecast “Actual” reading would likely bolster the Pound but pressure the index by reducing the likelihood of Bank of England interest rate cuts. This economic tension is being reflected on the UK100 daily chart price action, where global sentiment from the World Economic Forum is also influencing market direction.
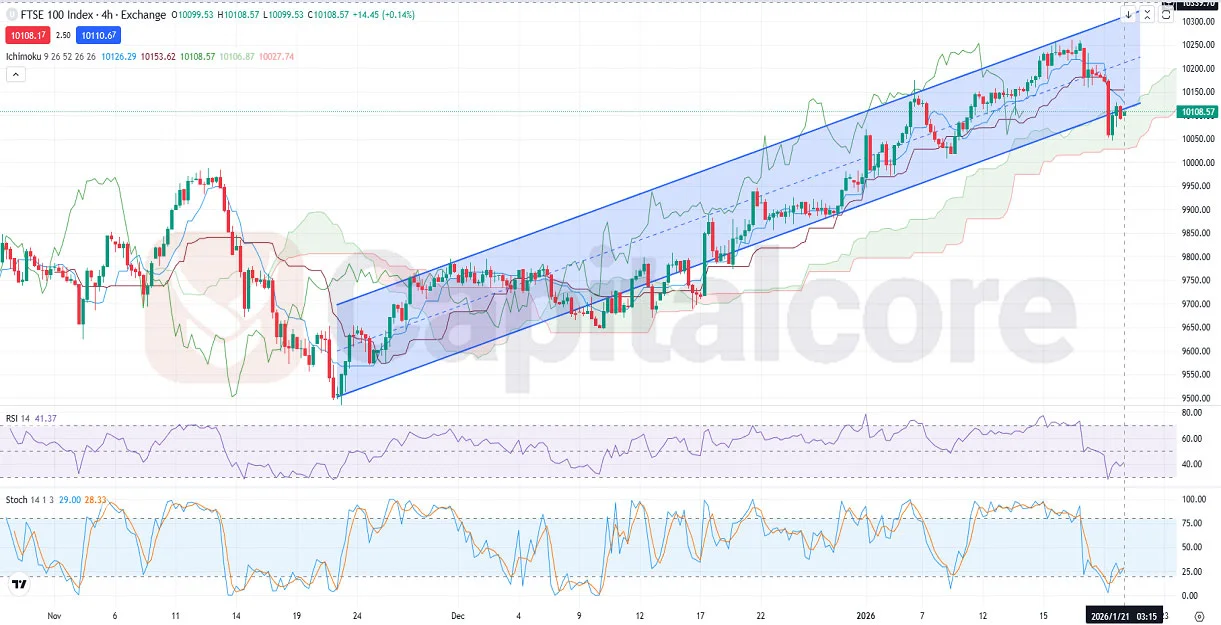
Chart Notes:
• Chart time-zone is UTC (+02:00)
• Candles’ time-frame is 4h.
Technically, the H4 chart shows that for months, the index has moved within a bullish channel, typically gravitating toward the midline after breakouts. Following a recent sharp bearish candle that breached the trendline, price action has returned to the channel, suggesting a move back toward the midline. Current indicators support this potential recovery, with the Ichimoku Cloud (10126.29, 10108.57, 10106.87, 10027.74) acting as a pivot zone, while an RSI (14) of 41.37 and Stochastic (14, 1, 3) at 29.00 indicate the index is emerging from oversold conditions.
•DISCLAIMER: Please note that the above analysis is not an investment suggestion by “Capitalcore LLC”. This post has been published only for educational purposes.