US30 Williams Percent R Suggests Caution
The US30, also known as the Dow Jones Industrial Average (DJIA) or simply the “Dow”, is a key benchmark index representing 30 major U.S. companies. In the forex market, it is a widely traded index reflecting investor sentiment toward the overall U.S. economy, often moving in response to macroeconomic data and geopolitical developments. Fundamentally, today’s focus for the US30 traders will center around key U.S. data releases. The ADP Employment data is expected to provide high-frequency insights into private-sector job growth, and any positive surprise here could reinforce optimism around the labor market. Additionally, housing price indicators from both FHFA and S&P/Case-Shiller could influence market sentiment, especially if they reflect strength in the real estate sector. The CB Consumer Confidence report and Richmond Manufacturing Index will further help shape the broader economic outlook, offering real-time signals on consumer and business sentiment. A scheduled speech by President Trump may inject volatility if it touches on economic policy, taxes, or interest rates. Overall, strong readings across these reports are likely to bolster the US dollar, while any negative surprises could shift investor sentiment toward risk-off, impacting the US30 performance on the day.
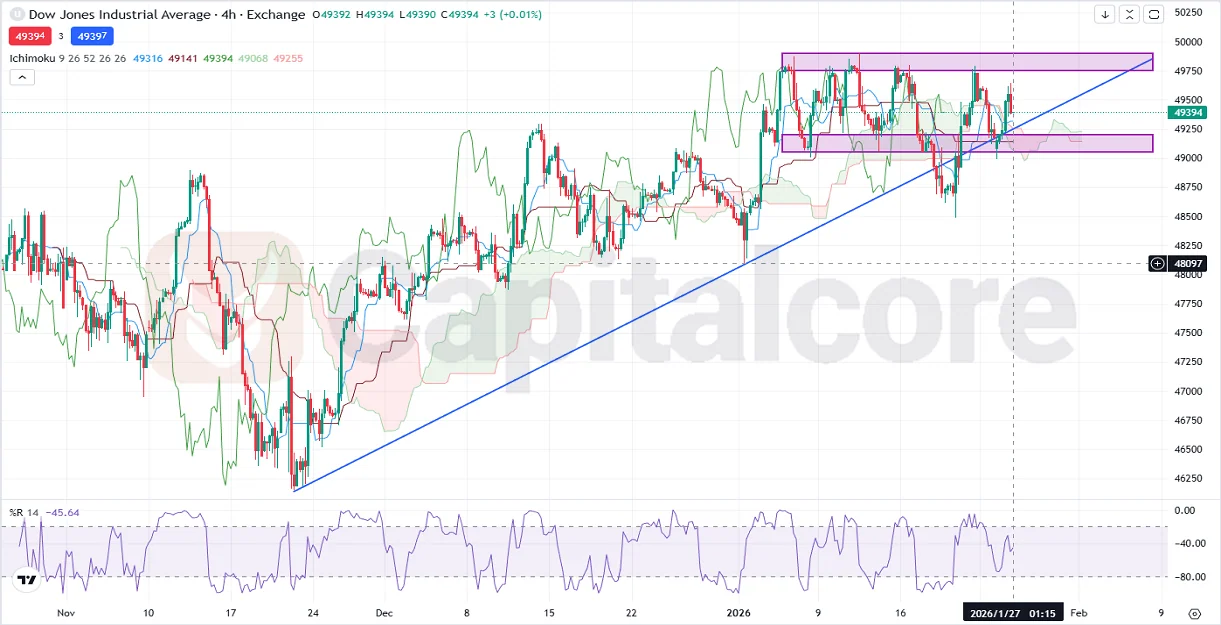
Chart Notes:
• Chart time-zone is UTC (+02:00)
• Candles’ time-frame is 4h.
On the H4 chart of the US30 (Dow Jones), price action remains in a bullish uptrend, respecting a clearly defined ascending trendline dating back to late November. Price is currently consolidating between the 49200 support zone and strong resistance around 49750, as highlighted by the horizontal rectangles. The market structure indicates sideways movement with bullish corrections, showing signs of market indecision but still within an upward bias. The Ichimoku Cloud is green but thin, suggesting weak but intact bullish momentum. The cloud’s horizontal base near 49200 reinforces the support zone, while the Tenkan-sen and Kijun-sen lines are also flattened, hinting at consolidation. The %R (Williams %R) sits at -45.64, placing it in a neutral zone – neither overbought nor oversold – indicating a possible continuation of the range-bound pattern before a breakout. Traders should watch for a clean breakout above 49750 for bullish continuation, or a drop below the trendline and cloud base for a bearish shift.
•DISCLAIMER: Please note that the above analysis is not an investment suggestion by “Capitalcore LLC”. This post has been published only for educational purposes.