can this be the start of a trend reversal?
The bearish trendline on EUR/CHF which started forming on 12 Des 2019, finally broke and EUR/USD price right now is showing some signs of a trend reversal. a strong support level at 1.0505 – 10.0525 formed a few days ago and the price is currently reacting to this. the other important area around is the resistance at about 1.06335 which is 0.236 Fibo level of the previous descending line. As we believe here the price should make a critical move, here we listed the most possible outcomes in the up coming days.
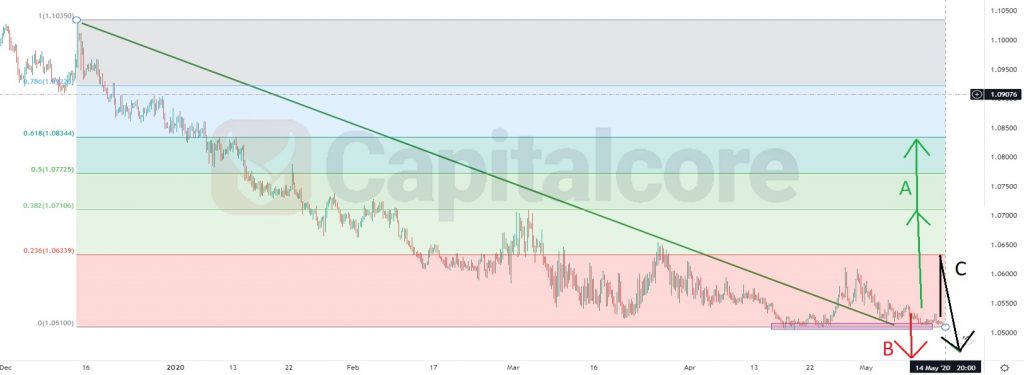
Chart Notes:
• Chart time-zone is UTC (+03:00)
• Candles’ time-frame is daily.
So based on what we can see on the chart, there are three possible outcomes for EUR/CHF chart in the next few days:
• A: in case we can find any ascending signal in 1h or 30m candles, we can be waiting for a trend reversal. the destination of this trend could be level 0.382 of Fibo retracement which would be at about 1.071 or if it can break that resistance too, we can be expecting to see the price at 1.0835 which is level 618 of the Fibo on the previous descending wave.
• B: in this theory, again the current support level can pump the price once more, but with a less growth in price, comparing to theory A; then the price wont be able to break the resistance in 1.0635 -1.066 and after that again comes back to the current support level. this will impower the possibility of scenario C.
• C: if at any point, the current support level at 1.0505 cant hold the price, the descending wave would continue its way downward strongly, the destination of this move could be 1.03 -1.02 based on the descending power.
• DISCLAIMER: Please note that the above analysis is not an investment suggestion by “Capitalcore Ltd”. This post has been published only for educational purposes.