Manufacturing Sales and ANZ Business Confidence were released in New Zealand and the US will publish NFIB Small Business Index. As we believe the New Zealand should be planning to strengthening NZD, the price chart also is showing some buy signals. In the following we have prepared you a quick review of the price chart.
Chart Notes:
• Chart time-zone is UTC (+03:00)
• Candles’ time-frame is 4h.
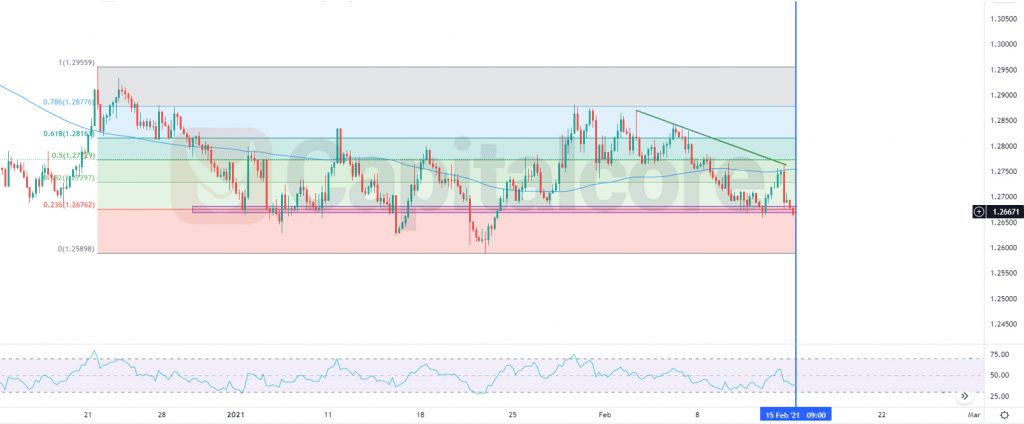
The support rests at 0.70910 with resistance at 0.72460 which the weekly pivot point at 0.71900 is located in between the lines. The EMA of 10 is moving with bullish bias in the descendant channel and it is below the EMA of 200 and the EMA of 100. The RSI is moving below level 50, the MACD line is above the signal line in the positive territory and the Stochastic is showing upward momentum. The ADX is showing buy signal. The price is below the Ichimoku Cloud and below the Chinkou Span. The Tenkan-sen is showing a downward trend and the Kijun-sen is showing a horizontal trend.
NZDUSD is trying to grow after the decline. Buyers can expect 0.72800.
• DISCLAIMER: Please note that the above analysis is not an investment suggestion by “Capitalcore Ltd”. This post has been published only for educational purposes.