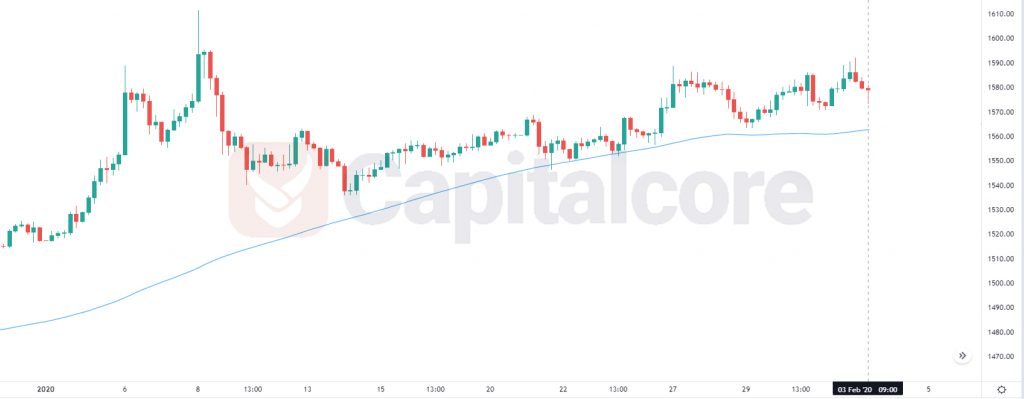
Gold price is trending bullish by the spread of Crona Virus
The spread of corona virus is weakening all currencies comparing to other form of assets. Metals and cryptocurrency price is on a bullish trend as the economical system of the world is getting harmed by the epidemic out break of Covid19. the following is a technical analyze of gold price chart; in case the information given below sets right with your trading setting , you can use it to strengthen your trading strategy.

Chart Notes:
• Chart time-zone is UTC (+03:00)
• Candles’ time-frame is 4h.
The support rests at 1571.15 with resistance at 1590.15 which the weekly pivot point at 1577.97 is located in between the lines. The EMA of 10 is moving with bullish bias in the ascendant channel and it is above the EMA of 200 and the EMA of 100. The RSI is moving on 50 level, the Stochastic is moving in low ranges and the MACD line is below the signal line in the negative territory. The ADX is not showing any clear signals. The price is above the Ichimoku Cloud and below the Chinkou Span. The Tenkan-sen and the Kijun-sen are both showing a horizontal trend.
Long positions are recommended towards 1595.
• DISCLAIMER: Please note that the above analysis is not an investment suggestion by “Capitalcore Ltd”. This post has been published only for educational purposes.


