The dollar index is attracting more investors after several days of decline. The US is receiving mixed fundamental data. The IMF report weighed on both the dollar the euro. Meanwhile on the price chart, the price is on a very strong resistance. Before the price breaks the resistance, we can’t say a bullish trend is started.
Chart Notes:
• Chart time-zone is UTC (+03:00)
• Candles’ time-frame is 4h.
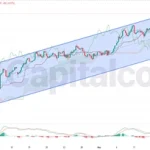
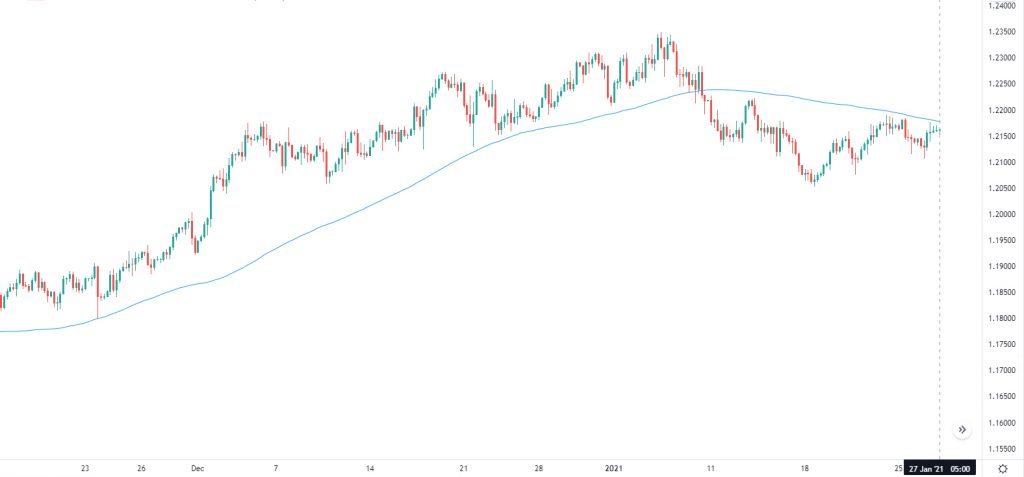
The support rests at 1.21210 with resistance at 1.21890. The weekly pivot point at 1.21380 is located in between the lines. The EMA of 10 is moving with bullish bias in the ascendant channel and it is below the EMA of 100 and above the EMA of 200. The Stochastic is moving in high ranges, the RSI is falling towards level 50 and the ADX is showing sell signal. The MACD indicator is in neutral territory.
The EUR bulls are pushing the price up towards 1.22000.
• DISCLAIMER: Please note that the above analysis is not an investment suggestion by “Capitalcore Ltd”. This post has been published only for educational purposes.