Market News
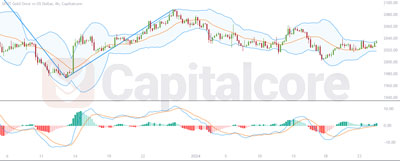
Comprehensive H4 EUR/USD Analysis: Deciphering Market Trends with Parabolic SAR, Bollinger Bands, and MACD
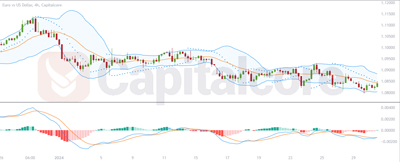
Interpreting EUR/USD’s Movement Analyzing the EUR/USD market on the H4 time frame, as shown in the uploaded chart, we see
Interpreting EUR/USD’s Movement Analyzing the EUR/USD market on the H4 time frame, as shown in the uploaded chart, we see
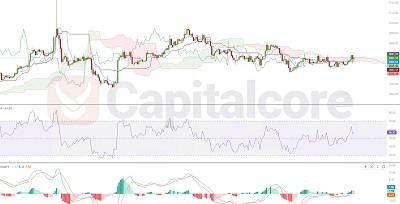
“Interpreting Gold’s Direction: Technical Indicators Ichimoku, MACD, and RSI Offer Clues on the H4 Chart Analyzing the Gold market on
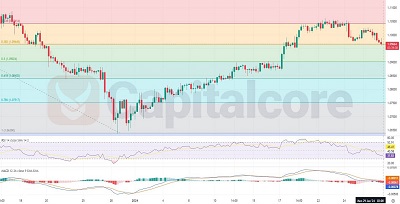
GBPCHF: Interpreting MACD and RSI Fluctuations The GBPCHF pair represents the exchange rate between the British Pound and the Swiss
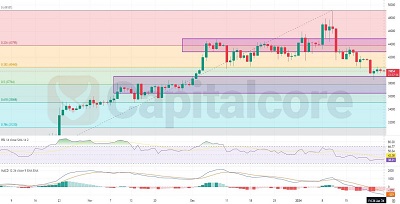
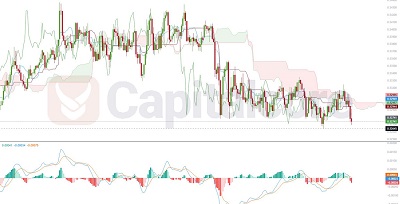
Bitcoin’s Price Action Suggests Downtrend Continuation BTCUSD, representing the Bitcoin to US Dollar exchange rate, is a highly volatile pair
Gold’s Glimmer on the 4-Hour Chart: A Potential Uptrend in the Making The SPOT Gold against the US Dollar, as
Ichimoku Cloud and MACD Concur: NZD/CHF Bears Dominate the 4-Hour Frame The NZD/CHF currency pair, as depicted in the H4
EURCAD H4 Chart: Indecision Within Ichimoku Cloud The EUR/CAD pair, represented on the H4 chart, offers insights into the exchange
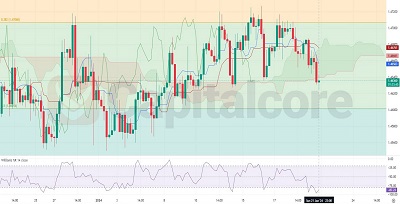
Navigating the Shift: GBPCAD’s Parabolic SAR and MACD Suggest a Change in Trend The GBPCAD pair has demonstrated a clear
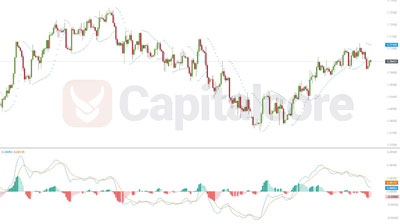
Technical Outlook on EURCHF: Anticipating the Next Move Amidst Market Indecision The EURCHF 4-hour chart exhibits a downtrend characterized by