H4 US500 Price Movement and Indicator Insights
The US500 index, commonly referred to as the S&P 500, serves as a critical benchmark for the U.S. stock market and reflects the overall economic health through the valuation of its 500 largest publicly traded companies. Given its significant influence, traders closely monitor economic indicators such as Non-Farm Payrolls (NFP), Unemployment Rates, and various Federal Reserve statements. Today, market participants anticipate crucial data releases and Fed speeches that could significantly influence price action through impacts on inflation, labor market conditions, and overall economic outlook. Positive employment data or a hawkish stance from Fed members would typically strengthen the US500 index, whereas weaker data or dovish comments might trigger bearish sentiment.
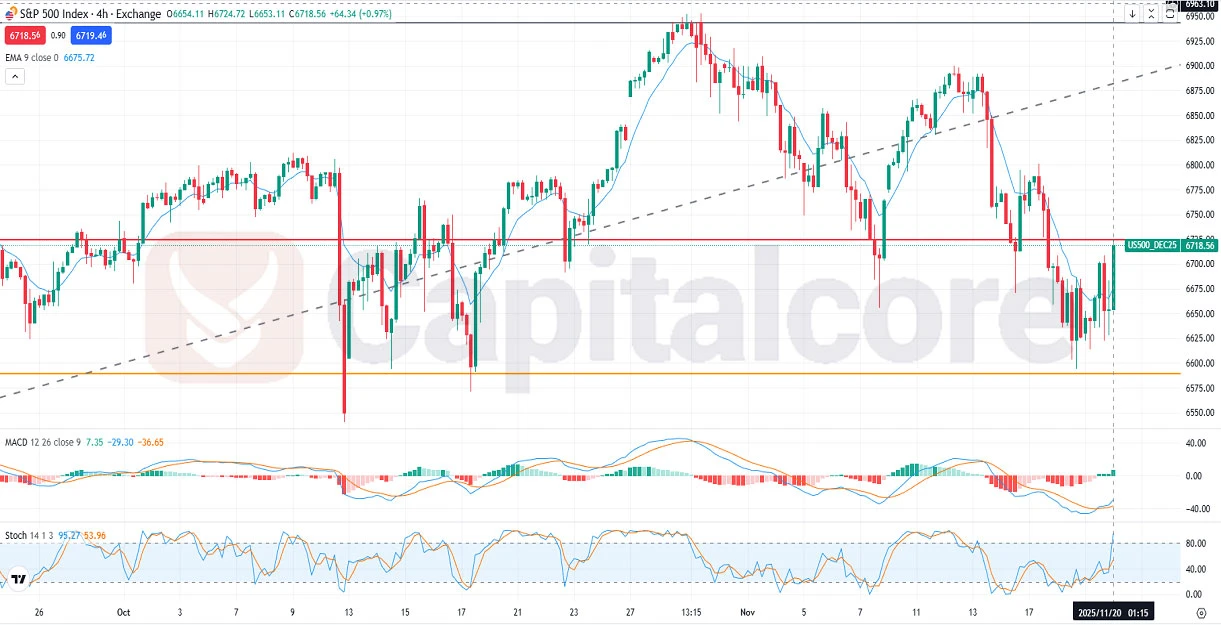
Chart Notes:
• Chart time-zone is UTC (+02:00)
• Candles’ time-frame is 4h.
Analyzing the US500 H4 technical chart reveals that the index has recently shifted from a prolonged bullish trend into a bearish movement, possibly indicating a corrective phase or the early stages of a trend reversal. The price action currently interacts around the 0.382 Fibonacci retracement level, indicating potential bullish recovery continuation. Technical indicators further support this scenario: the MACD histogram (7.35, -29.30, -36.65) is below the zero line but signaling a decreasing bearish momentum, and the Stochastic oscillator (95.27, 53.96) is showing near-overbought conditions, indicating short-term bullish exhaustion. Additionally, the EMA (9) at 6675.72 is acting as dynamic support, suggesting a possible price stabilization around current levels before resuming an upward trajectory. Nevertheless, traders should be cautious, as any negative fundamental surprise could swiftly reignite bearish pressures.
•DISCLAIMER: Please note that the above analysis is not an investment suggestion by “Capitalcore LLC”. This post has been published only for educational purposes.


