AUDUSD Bearish Reversal Price Action Outlook
The AUDUSD forex pair, also known as the Aussie, represents the exchange rate between the Australian dollar and the US dollar and ranks among the most traded currency crosses globally, favored by price action traders tracking commodity-linked flows. Known colloquially as the Aussie, AUDUSD routinely features in EURUSD daily chart technical analysis discussions due to its sensitivity to global risk sentiment. With today’s Flash Manufacturing PMI (52.1) and Flash Services PMI (51.6) for AUD at 2:00 am, FOMC member Waller speaking at 4:35 pm, US Flash Manufacturing PMI (49.0 vs. 50.2) and Flash Services PMI (52.8 vs. 54.4) at 4:45 pm, plus US Crude Oil Inventories at 5:30 pm, the fundamental backdrop suggests that resilient Australian PMI prints could support the Aussie, yet any hawkish tilt from Waller or a surprise draw in oil stocks may bolster the US dollar and reshape the EURUSD daily chart fundamental analysis.
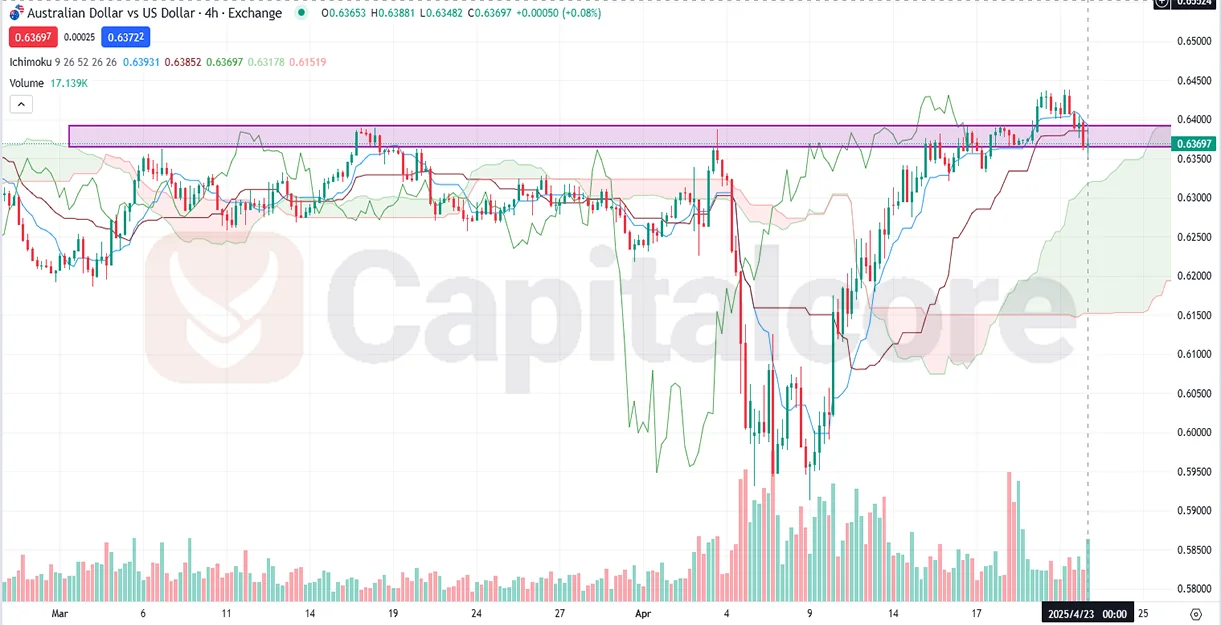
Chart Notes:
• Chart time-zone is UTC (+03:00)
• Candles’ time-frame is 4h.
On the AUDUSD H4 chart technical analysis, the price line has recently surged through a bullish wave and now confronts a strong resistance level coinciding with the flat Span B of the Ichimoku cloud. While the price sits above the cloud—an overall bullish signal—the flat cloud resistance implies a barrier to further gains. Moreover, volume has declined during the ascent, indicating weakening market conviction in the rally and pointing to a high probability of a bearish wave forming. Traders should watch for price action rejection at this resistance zone to confirm a potential reversal.
• DISCLAIMER: Please note that the above analysis is not an investment suggestion by “Capitalcore LLC”. This post has been published only for educational purposes.
