Watching Key Levels After Trendline Breach
The USDCAD pair, known as the “Loonie,” reflects U.S. and Canadian economic interplay, especially sensitive to inflation data and oil prices. Today, Canadian Building Permits rose 1.9% after a prior -4.1%, hinting at a housing sector rebound. In the U.S., Core CPI came in at 0.3% m/m (above 0.2% prior), with annual CPI rising to 2.5%, reinforcing inflation concerns and supporting USD strength. Crude Oil Inventories fell by 2.4M barrels, less than the previous -4.3M, offering only limited support for oil-sensitive CAD. Meanwhile, the U.S. Federal Budget posted a sharp -$314.3B deficit, adding fiscal uncertainty. Overall, firmer U.S. inflation and a modest Canadian recovery create mixed signals, but the USD may gain near-term advantage on stronger CPI data.
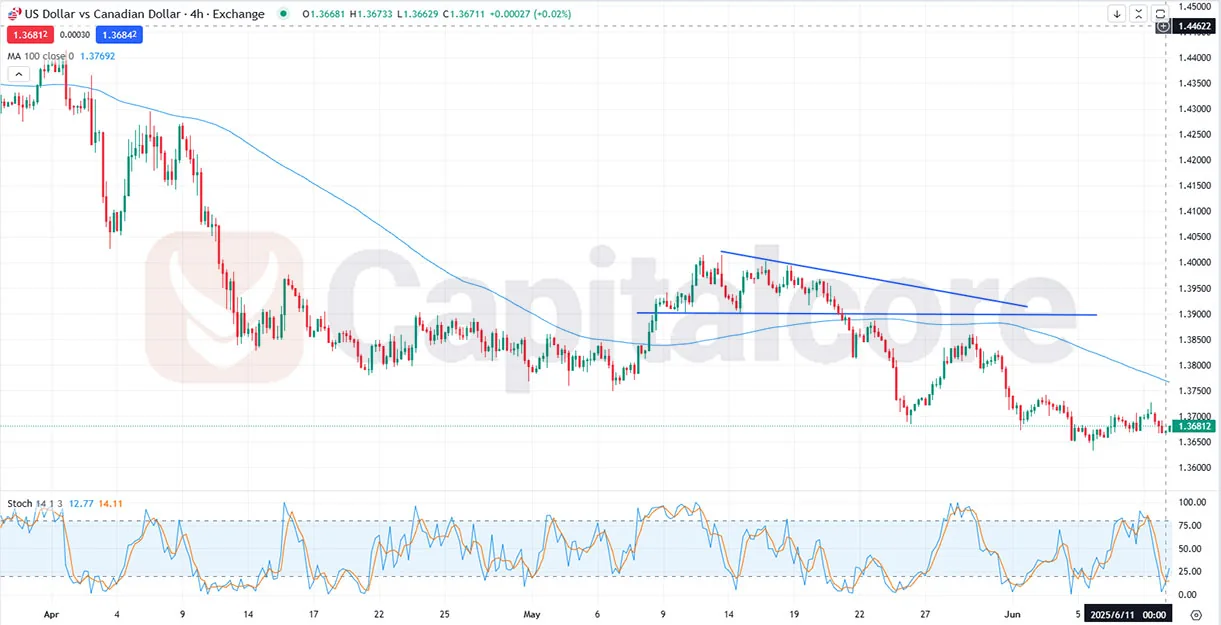
Chart Notes:
• Chart time-zone is UTC (+03:00)
• Candles’ time-frame is 4h.
On the technical front, the USDCAD pair is showing early signs of bearish pressure on the 4-hour chart. Price action recently broke below a short-term ascending trendline, suggesting a loss of bullish momentum. The RSI is currently at 44.96, indicating neutral-to-weak momentum with a slight bearish bias as it trends downward. The MACD histogram is near the zero line, with the MACD and signal lines slightly in bearish alignment, pointing to a possible continuation of downside movement. Unless the pair reclaims the broken trendline and builds above 1.3700, further bearish extension toward the 1.3620–1.3600 area is likely. Overall, technical indicators support a cautious bearish outlook for USDCAD in the short term, with traders watching for either a rebound above the trendline or a deeper slide confirming a shift in sentiment.
•DISCLAIMER: Please note that the above analysis is not an investment suggestion by “Capitalcore LLC”. This post has been published only for educational purposes.


