MACD and RSI Indicate Bullish Potential
Bitcoin, often referred to as “digital gold,” is the world’s largest cryptocurrency by market capitalization, and its pairing with the US dollar (BTCUSD) remains a pivotal benchmark in both cryptocurrency and forex markets. With several major US economic events scheduled today—including Federal Reserve speeches by Thomas Barkin, Michael Barr, and Raphael Bostic, as well as key data releases such as the Core PCE Price Index, Personal Income, and Personal Spending—the US dollar may experience notable volatility that could influence BTCUSD daily chart technical and fundamental analysis. Hawkish signals regarding interest rates, or shifts in inflation and consumer spending, may drive significant price action in this cryptocurrency pair as traders weigh the potential for tighter monetary policy and broader market sentiment.
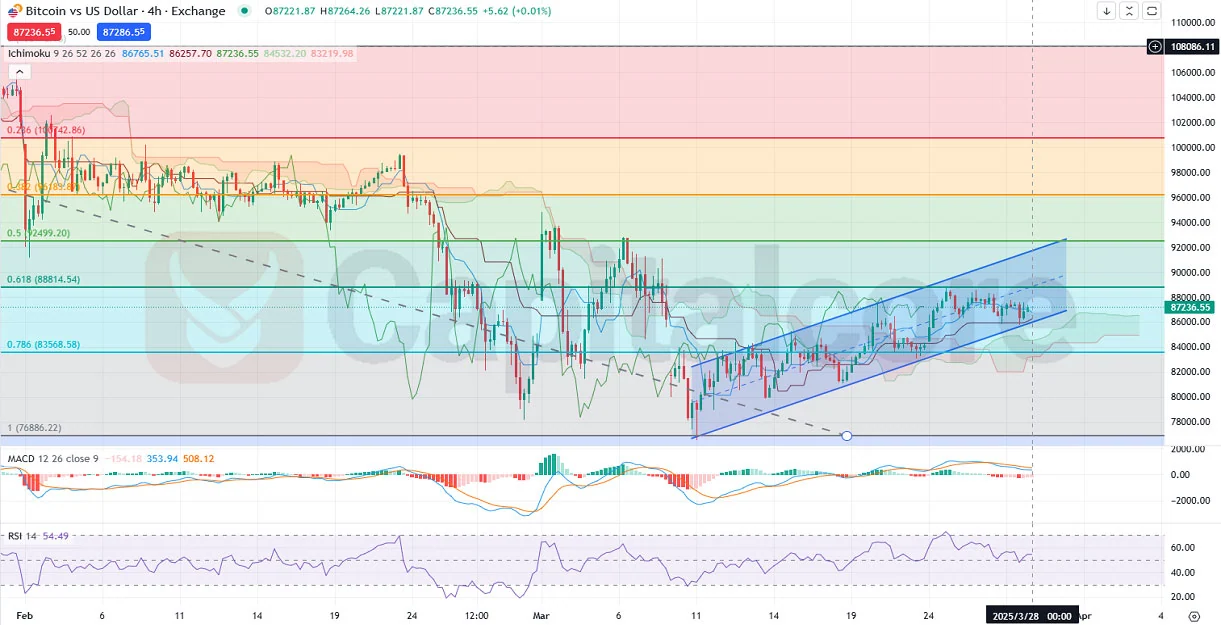
Chart Notes:
• Chart time-zone is UTC (+02:00)
• Candles’ time-frame is 4h.
On the BTCUSD H4 chart, the price is exhibiting slightly bullish momentum, moving above the Ichimoku cloud between the 0.786 and 0.618 Fibonacci retracement levels and heading toward the 0.618 level, which could serve as the first resistance. A stronger resistance appears at the 0.5 Fib level, while the green Ichimoku cloud’s upper and lower boundaries are moving horizontally, suggesting caution. Meanwhile, MACD and RSI indicators point to ongoing bullish potential, though traders should monitor any break above these resistance zones to confirm further upward price action in BTCUSD daily chart technical analysis.
• DISCLAIMER: Please note that the above analysis is not an investment suggestion by “Capitalcore LLC”. This post has been published only for educational purposes.
