Bitcoin Dollar Outlook Before Fed Waller
BTC/USD, often called the Bitcoin Dollar or BTC Dollar, represents Bitcoin priced against the US Dollar, combining the world’s leading cryptocurrency with the global reserve currency. Unlike traditional forex pairs, BTC-USD has no universally accepted nickname like Cable or Fiber, but it is one of the most followed crypto forex pairs for daily chart technical and fundamental analysis. Fundamentally, today’s BTC USD outlook is driven by USD news including University of Michigan Consumer Sentiment, UoM Inflation Expectations, CB Leading Index data, and Federal Reserve Governor Christopher Waller’s speech on the economic outlook; stronger US consumer confidence, higher inflation expectations, or hawkish Fed commentary could support the US Dollar and pressure Bitcoin price action, while softer data or dovish signals may weaken USD momentum and help BTCUSD recover. The reported final draft of a US-Iran agreement could also improve broader risk sentiment if confirmed, potentially supporting crypto demand, although lower geopolitical risk may reduce defensive flows and keep BTC-USD traders focused on dollar strength, Fed policy expectations, and intraday volatility.
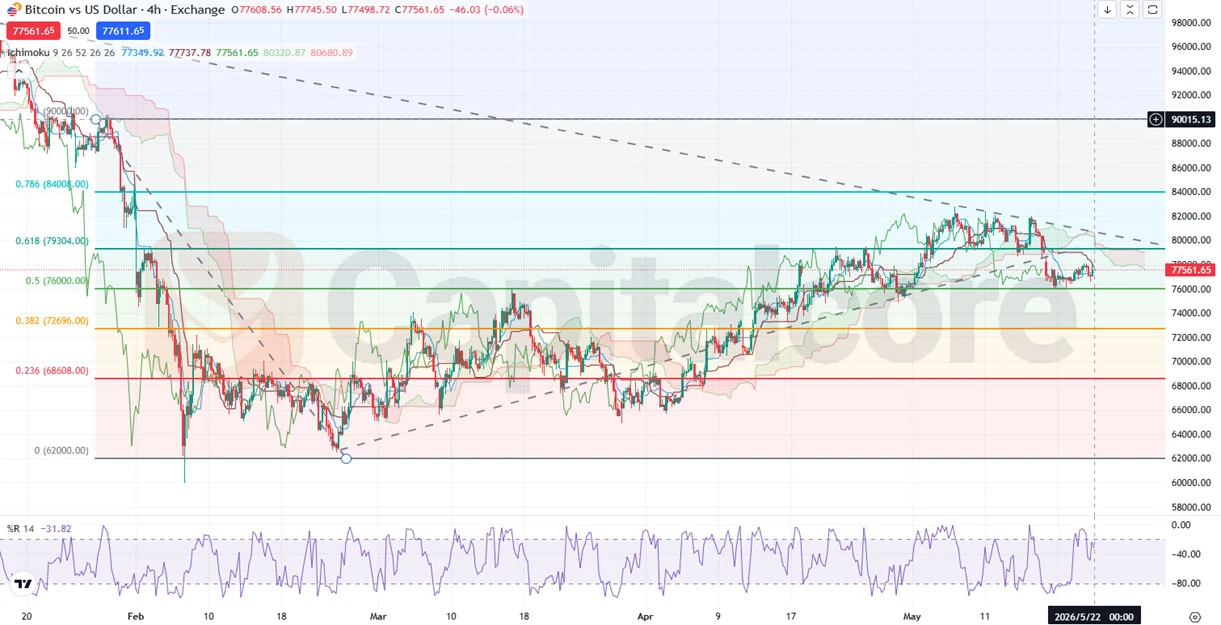
Chart Notes:
• Chart time-zone is UTC (+03:00)
• Candles’ time-frame is 4h
The uploaded BTC/USD H4 chart shows Bitcoin consolidating inside a broad ascending structure after rejecting the descending trendline around the 80000 resistance zone, creating a possible bearish flag or range compression setup. Price is trading near the key 0.5 Fibonacci retracement around 76000, which is acting as immediate BTCUSD support together with the Ichimoku Kijun and cloud base near 75500 to 76000; a clean H4 breakdown could expose 72700 at the 0.382 Fibonacci level, followed by 68600 at the 0.236 Fibonacci support. On the upside, BTC/USD resistance remains at 79300 near the 0.618 Fibonacci level, then 84000 around the 0.786 Fibonacci zone, with major price action resistance near 90000. Ichimoku signals weakening bullish momentum as candles move into or below the cloud while Tenkan and Kijun flatten, giving the BTCUSD H4 technical analysis a neutral to bearish short term bias unless price reclaims 79000 with strong candles. Williams %R is recovering from oversold territory toward the minus 30 area, showing a short term bounce attempt, but the small body candlesticks near support reflect indecision rather than confirmed bullish continuation.
•DISCLAIMER: Please note that the above analysis is not an investment suggestion by “Capitalcore LLC”. This post has been published only for educational purposes.


