How US and Australian Economic Data Affect AUDUSD Today
The AUD/USD pair, often referred to as the “Aussie Dollar,” is a popular currency pair in the forex market, representing the exchange rate between the Australian Dollar and the US Dollar. It is significantly influenced by economic events and data from both Australia and the United States, with commodity prices, employment figures, and central bank policies playing key roles in its movements. Today, the market is awaiting crucial economic reports. For Australia, the employment data, including changes in employment and the unemployment rate, will be highly anticipated. A positive outcome could signal economic strength, supporting the Aussie Dollar. Conversely, the US will release Treasury International Capital (TIC) data, reflecting foreign demand for US securities. If the TIC data exceeds expectations, it could boost the US Dollar as increased foreign investment in US assets generally leads to higher demand for USD. Additionally, the US Juneteenth holiday could result in low liquidity, which may lead to irregular volatility in the forex market, impacting the AUDUSD pair.
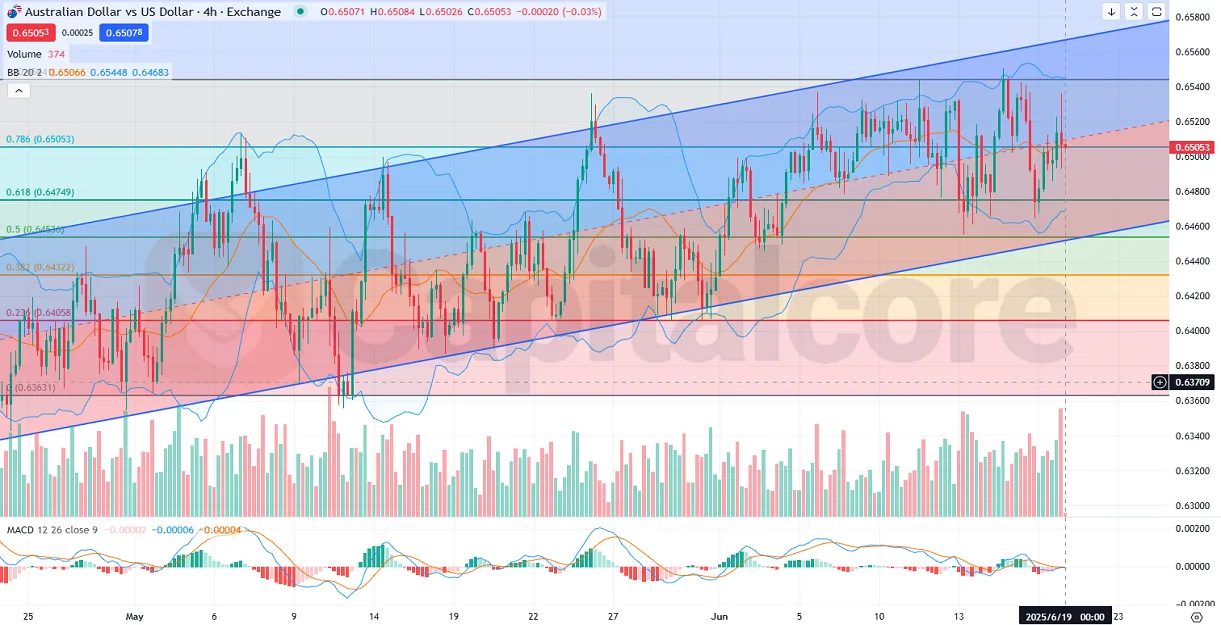
Chart Notes:
• Chart time-zone is UTC (+03:00)
• Candles’ time-frame is 4h.
The H4 chart for AUD/USD reveals a price moving within a slight bullish trend, marked by several ups and downs. The price has been fluctuating between the upper and lower bands of the Bollinger Bands, indicating some volatility. Recently, the price has moved from the lower band toward the upper band and is now encountering resistance at the middle band. This middle band is aligning with the 0.786 Fibonacci retracement level and the center line of the regression trend, which together act as a strong resistance zone. The last candlestick is red, indicating the AUD USD price could struggle to break through this resistance. Additionally, volume indicators show a decline in momentum, with the previous large red candle followed by a smaller red candle. This suggests that the market may be losing bullish momentum, and the price could face a pullback before any further upward movement. The MACD and histogram also indicate weakening bullish momentum, further supporting the idea that the price may struggle to break through the resistance at the 0.786 Fibonacci level.
•DISCLAIMER: Please note that the above analysis is not an investment suggestion by “Capitalcore LLC”. This post has been published only for educational purposes.


