US30 Fundamental Analysis With NFP
US30, commonly known as the Dow or Wall Street 30, tracks the Dow Jones Industrial Average and is a USD denominated index CFD that reflects sentiment across major blue chip US stocks. For today’s US30 fundamental analysis, traders should focus on high impact USD news including Fed Governor Lisa Cook’s speech, labor inflation data, Non Farm Payrolls, unemployment rate, University of Michigan consumer sentiment and inflation expectations, plus wholesale inventories; stronger labor data, sticky inflation expectations or hawkish Fed guidance could support the US dollar and pressure risk assets, while softer employment or weaker sentiment may improve Dow Jones risk appetite. Geopolitical headlines around Iran, the Strait of Hormuz, US military access, oil market investigations and potential supply route tension add another layer of volatility, meaning US30 price action may react sharply to changes in oil prices, inflation expectations, Treasury yields and safe haven flows during the US30 H4 trading session.
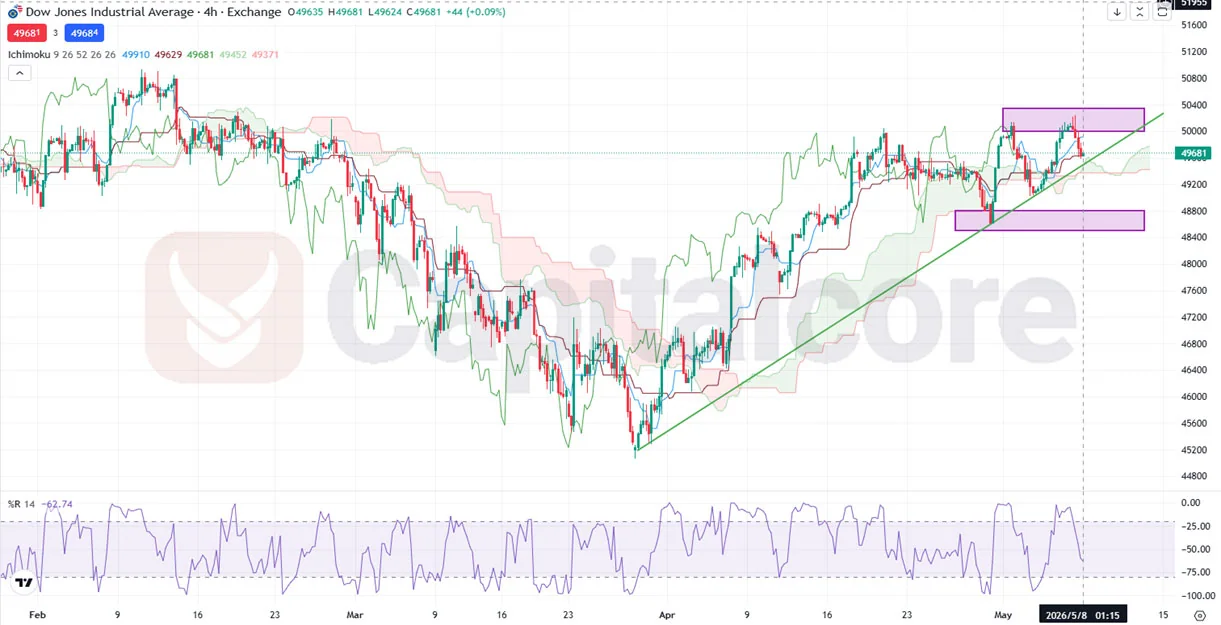
Chart Notes:
• Chart time-zone is UTC (+03:00)
• Candles’ time-frame is 4h
The US30 H4 chart technical analysis shows the broader trend remains bullish because price is still trading above the Ichimoku cloud and continues to respect the rising trendline from the March low. However, the latest candles show rejection from the upper resistance area near 50000 to 50300, with a bearish pullback candle suggesting short term profit taking rather than a confirmed full reversal. Key support sits around 49300, where the trendline and Ichimoku structure remain important for bullish continuation, while deeper support appears near the lower demand zone around 48600 to 48800. Williams %R 14 is near 62.74 negative, showing momentum has cooled from overbought conditions and could weaken further if price breaks below 49300; as long as US30 holds above this level, buyers may attempt another move toward 50000 and 50300, but a clean H4 breakdown below the trendline would shift the Dow Jones technical outlook toward a corrective bearish scenario.
•DISCLAIMER: Please note that the above analysis is not an investment suggestion by “Capitalcore LLC”. This post has been published only for educational purposes.


