Euro dollar nears resistance amid PMI focus
The EUR/USD, also known as the “Fiber,” is the most traded currency pair in the forex market, representing the euro against the U.S. dollar. As a key barometer of economic sentiment in both the Eurozone and the U.S., the pair is closely watched by forex traders worldwide due to its high liquidity and sensitivity to macroeconomic data. Today, all eyes are on the high-impact PMI releases for both the Eurozone and the U.S., which serve as crucial leading indicators of economic health. The EUR may gain momentum if PMI figures from the manufacturing and services sectors show expansion above the 50.0 threshold, signaling a robust recovery. Likewise, strong U.S. data such as the National Employment Report and retail-related figures could boost the dollar, potentially limiting further gains for the euro. Given this backdrop, any deviation from forecasted PMI levels will likely spark volatility in the EUR-USD pair as traders react to new signals on inflation, growth, and labor market strength.
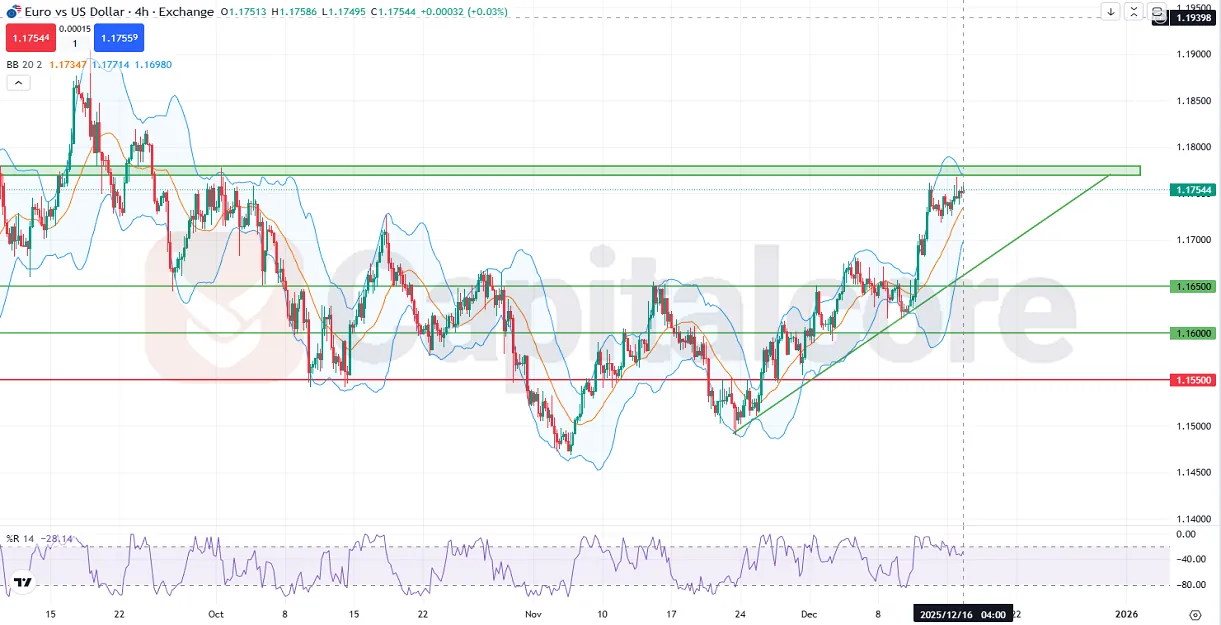
Chart Notes:
• Chart time-zone is UTC (+02:00)
• Candles’ time-frame is 4h.
From a technical perspective on the EUR/USD 4-hour chart, the price is in a strong upward movement, currently testing the resistance zone marked between 1.17000 and 1.18000. The pair is trending above the ascending trendline, indicating a bullish structure, and remains firmly above the middle Bollinger Band. The price is currently moving between the middle and upper bands of the Bollinger indicator, showing that bullish momentum remains intact but may be entering overbought territory. The %R (Williams %R) indicator is at -28.14, suggesting the pair is near overbought levels but still has room before hitting extreme conditions. If price breaks above the current resistance zone convincingly, a continuation toward 1.18500 or higher could be on the table. Conversely, first-line support lies around the midline of the Bollinger Bands and the lower band, both of which are sloping upward, supporting the bullish bias. As long as the price respects the trendline and stays within the upper Bollinger channel, the bullish price action on the daily chart remains valid.
•DISCLAIMER: Please note that the above analysis is not an investment suggestion by “Capitalcore LLC”. This post has been published only for educational purposes.


