EUR USD Daily Technical Analysis Fiber Stuck in Range
EUR/USD, popularly known as the “Fiber,” represents the currency exchange rate between the Euro and the US Dollar, two of the most traded currencies in the forex market. Today, traders closely monitor ECB Governing Council member Joachim Nagel’s speech and the release of the Manufacturing PMI reports from both Europe and the United States. Given Nagel’s influential position, a hawkish tone in his speech or PMI values higher than expected can significantly strengthen the Euro. Similarly, the US Manufacturing PMI and ISM data, crucial indicators of economic health, will dictate the USD’s performance, influencing short-term volatility and potentially shaping the pair’s immediate direction.
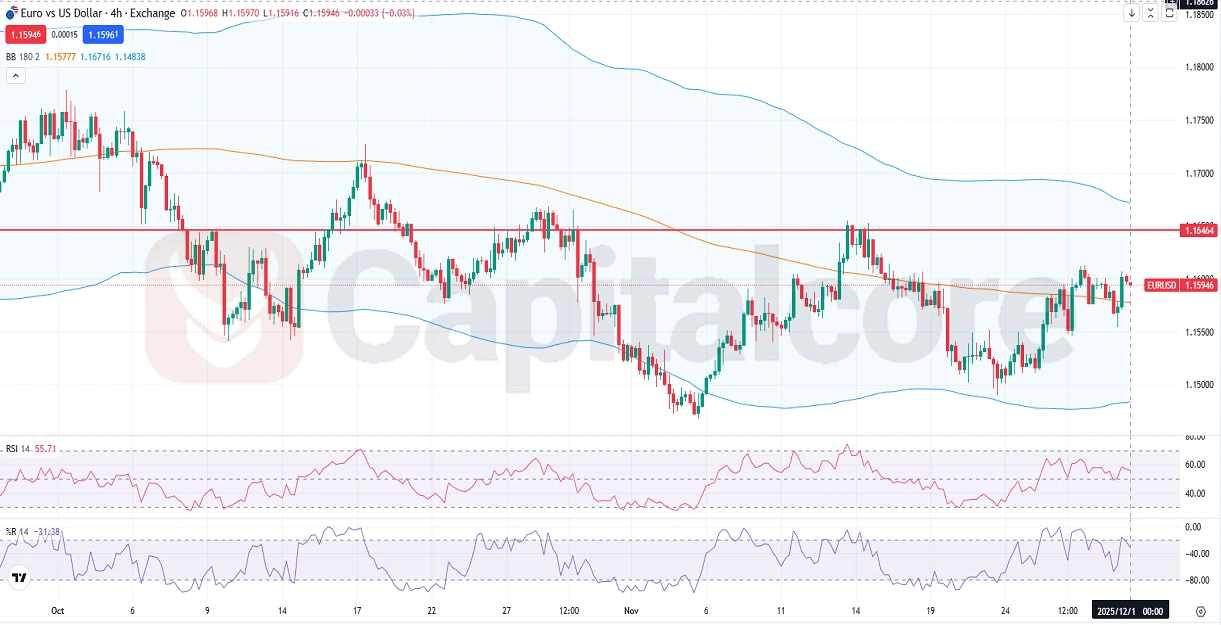
Chart Notes:
• Chart time-zone is UTC (+02:00)
• Candles’ time-frame is 4h.
Analyzing the EUR/USD H4 chart, the recent bearish trend appears to be concluding, demonstrated by the formation of a higher low. Currently, the candles are testing resistance beneath the previous high, reflecting market uncertainty. The Bollinger Bands (180 periods; upper band at 1.16716, middle at 1.15777, and lower at 1.14838) indicate market consolidation as candles fluctuate near the central line. The RSI (14) at 55.71 suggests neutrality with slight bullish inclination, while Williams %R (14) at -31.38 indicates minor bullish momentum but insufficient strength to push decisively higher. Thus, technical indicators confirm a sideways market scenario, with prices currently trapped within a range.
•DISCLAIMER: Please note that the above analysis is not an investment suggestion by “Capitalcore LLC”. This post has been published only for educational purposes.


