GBPUSD Breakout Signals and Hidden Divergence
The GBP/USD, popularly known as the “Cable,” represents the British pound sterling against the US dollar. It’s one of the oldest and most actively traded currency pairs globally. Today, GBP/USD traders closely watch BOE Governor Andrew Bailey’s speeches at both the Financial Times Global Boardroom Conference and the UK Covid-19 Inquiry. Hawkish sentiments from Governor Bailey regarding UK’s monetary policy and financial stability could positively influence GBP, while US dollar investors will closely monitor initial jobless claims and trade balance reports, potentially causing volatility depending on actual versus forecasted outcomes.
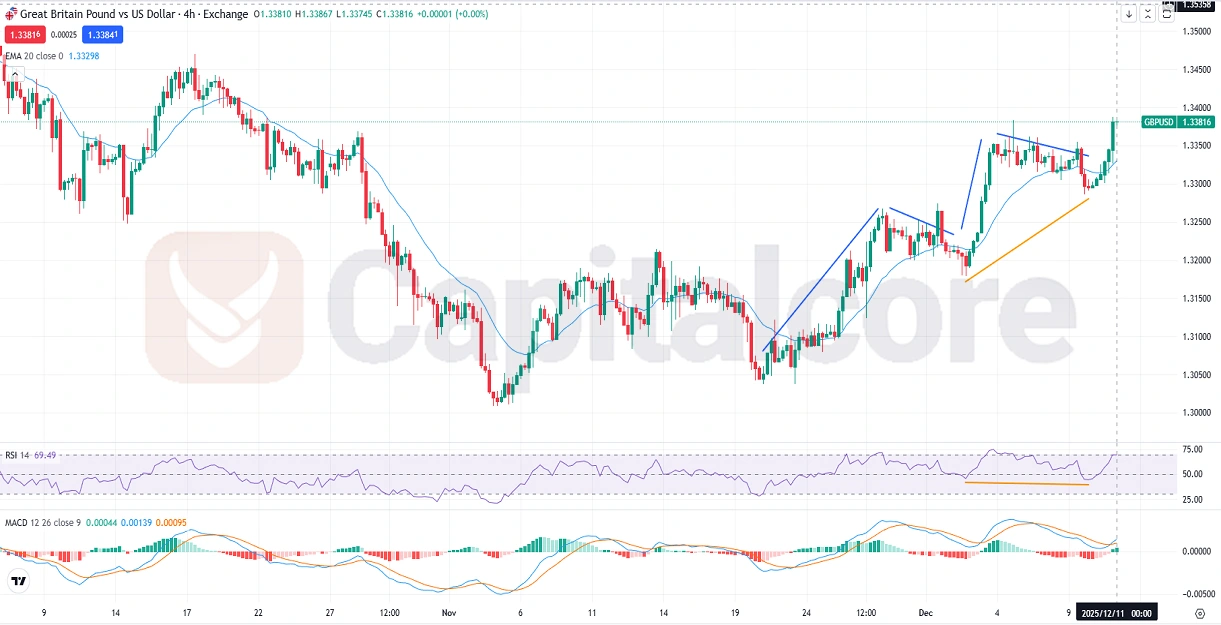
Chart Notes:
• Chart time-zone is UTC (+02:00)
• Candles’ time-frame is 4h.
Analyzing the GBP/USD H4 chart, after a period of bearish price action, the pair is exhibiting strong bullish momentum. Recent candles illustrate brief corrections followed by significant upward movements, indicating sustained buyer strength. The current price approaches a previous resistance area from where a sharp bearish reversal previously occurred. However, the presence of a hidden bullish divergence on the RSI indicator at 69.49 suggests a probable bullish breakout. The price remains firmly above the EMA (20) line, reinforcing the bullish sentiment. Additionally, the MACD (12, 26, 9) indicator values (0.00044, 0.00139, 0.00095) signal bullish continuation potential.
•DISCLAIMER: Please note that the above analysis is not an investment suggestion by “Capitalcore LLC”. This post has been published only for educational purposes.


