XAUUSD Price Action Bullish Trend Outlook
GOLD, commonly traded as XAUUSD, is one of the most-watched assets in the forex market, representing the value of gold against the US Dollar (USD). Often referred to as the “safe haven” asset or the “yellow metal,” XAUUSD attracts global investors seeking protection during economic uncertainty, inflation risk, or shifts in monetary policy. In today’s XAUUSD analysis, traders are closely monitoring upcoming US Dollar news and Federal Reserve commentary, as several FOMC officials, including Austan Goolsbee, Mary Daly, Anna Paulson, Susan Collins, and Beth Hammack, are scheduled to speak about monetary policy and the economic outlook. Hawkish remarks from these policymakers could strengthen the USD, potentially pressuring gold prices, while dovish signals suggesting slower rate hikes or future easing could support bullish XAUUSD price action. Additionally, traders are watching key US labor and consumer spending indicators, including Non-Farm Payrolls, unemployment data, labor cost metrics, and retail sales figures, which are crucial leading indicators for inflation and economic growth. Stronger-than-expected data would typically boost the dollar and weigh on gold, while weaker results may reinforce gold’s safe haven demand, making today’s macro backdrop critical for short-term GOLD price action and forex market sentiment.
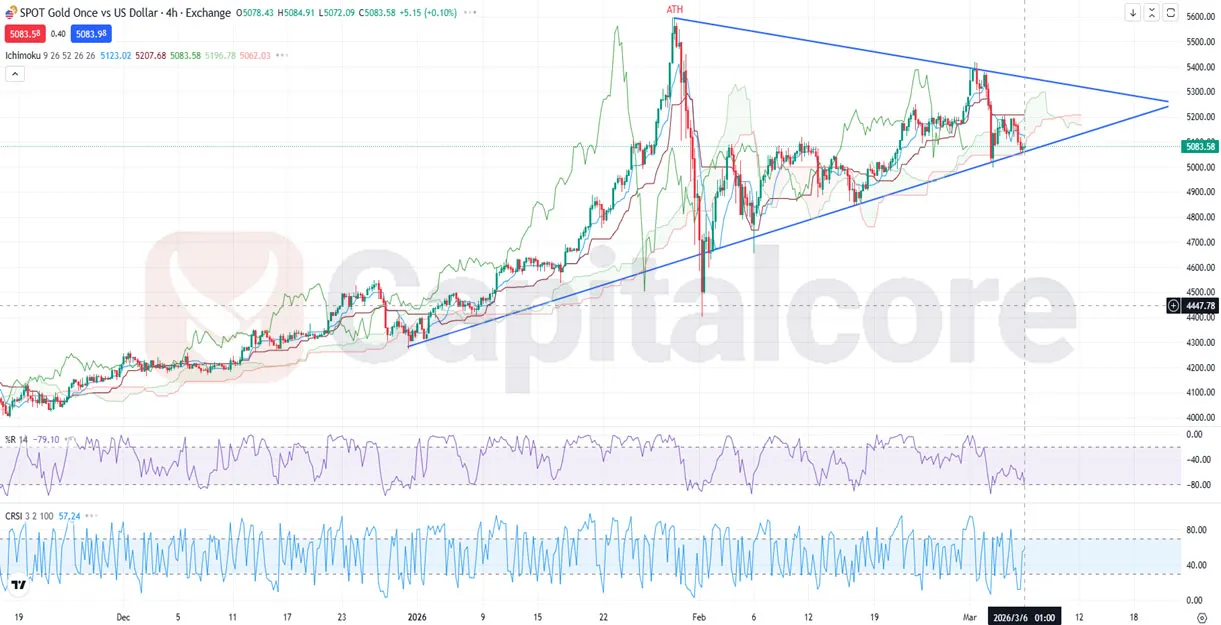
Chart Notes:
• Chart time-zone is UTC (+02:00)
• Candles’ time-frame is 4h.
From a GOLD H4 chart technical analysis perspective, the chart shows that after touching its all-time high near 5600 in January, gold experienced a sharp correction down toward the 4400 region, before recovering and stabilizing around the 5000–5200 range, recently testing 5400 again. Despite the volatility, the long-term bullish trend remains intact, as price continues to respect a rising ascending trendline support, which has been tested multiple times and repeatedly stopped deeper declines. Recently, a short-term pullback occurred, but the last two H4 candles are bullish green candles, forming after another successful touch of this ascending support line, suggesting buyers are defending the trend structure. The latest candle is positioned near the lower boundary of the Ichimoku Cloud, indicating a potential transition zone where momentum could shift back toward bullish continuation if price reclaims the cloud. Momentum indicators show mixed but improving signals: Williams %R is at -79.10, reflecting near-oversold conditions that often precede a rebound, while CRSI at 57.24 indicates moderate bullish momentum building in the short term. Overall, the XAUUSD H4 price action analysis suggests consolidation within a symmetrical triangle formation, where the rising support line and descending resistance from the ATH converge; a breakout above the upper trendline could reopen the path toward 5400–5600 resistance, while failure to hold the support may trigger another corrective move toward the 5000 psychological level.
•DISCLAIMER: Please note that the above analysis is not an investment suggestion by “Capitalcore LLC”. This post has been published only for educational purposes.


