XAUUSD volatility squeeze analysis
GOLD/USD (XAU/USD), often called “Gold” or “Spot Gold,” is one of the most heavily traded safe-haven assets in the forex and commodities markets, known for its inverse correlation with the USD and its role as a hedge against inflation and economic uncertainty. Today’s fundamental landscape focuses primarily on USD-driven catalysts, as traders await key PCE inflation data— the Federal Reserve’s preferred inflation gauge— alongside the University of Michigan Consumer Sentiment and Inflation Expectations figures. Stronger-than-forecast PCE or improved consumer confidence could lift the USD and pressure XAU-USD lower, while weaker results may weaken the USD and support bullish momentum in GOLD-USD as markets adjust expectations for future Fed interest-rate decisions.
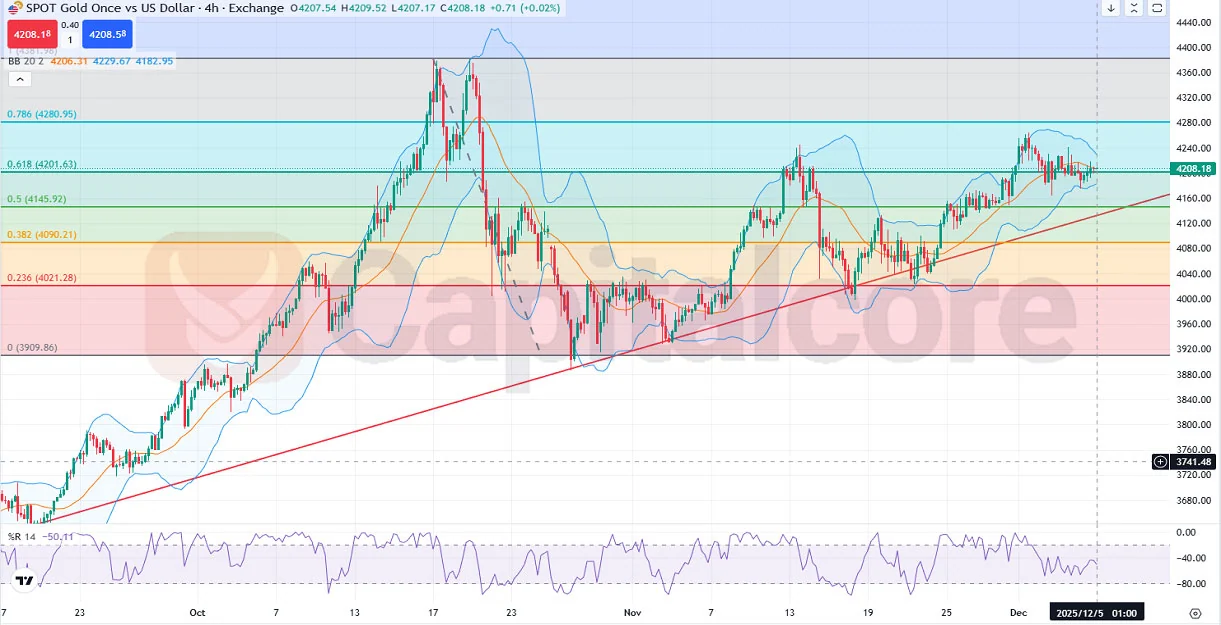
Chart Notes:
• Chart time-zone is UTC (+02:00)
• Candles’ time-frame is 4h.
On the H4 GOLD/USD chart, the price is moving within a bullish trend structure with periodic corrections, fluctuating between the upper and lower Bollinger Bands; it has recently touched the lower band and has now climbed back to hover around the middle band, which aligns closely with the key 0.618 Fibonacci retracement zone— an important area of technical equilibrium. The Bollinger Bands have tightened, indicating reduced volatility and the potential for an upcoming breakout, while the rising diagonal support line beneath recent candles has repeatedly prevented deeper declines, confirming buyers’ presence. The %R (14) indicator sits near –50.11, reflecting a neutral-to-mid-range momentum state that could flip bullish if price maintains support above the trendline and the 0.618 zone. Overall, GOLD price action on the H4 chart remains constructive, supported by trend structure, Fibonacci confluence, and narrowing volatility conditions that often precede directional extension.
•DISCLAIMER: Please note that the above analysis is not an investment suggestion by “Capitalcore LLC”. This post has been published only for educational purposes.


